 The Minneapolis-St. Paul metropolitan area is a national leader in finance, advanced manufacturing, agriculture and retailing.
Medical devices, electronics and processed foods are strong suits recognized globally.
Want the freshest data delivered by email? Subscribe to our regional newsletters.
9/20/2018 9:22:57 AM
Tim O'Neill
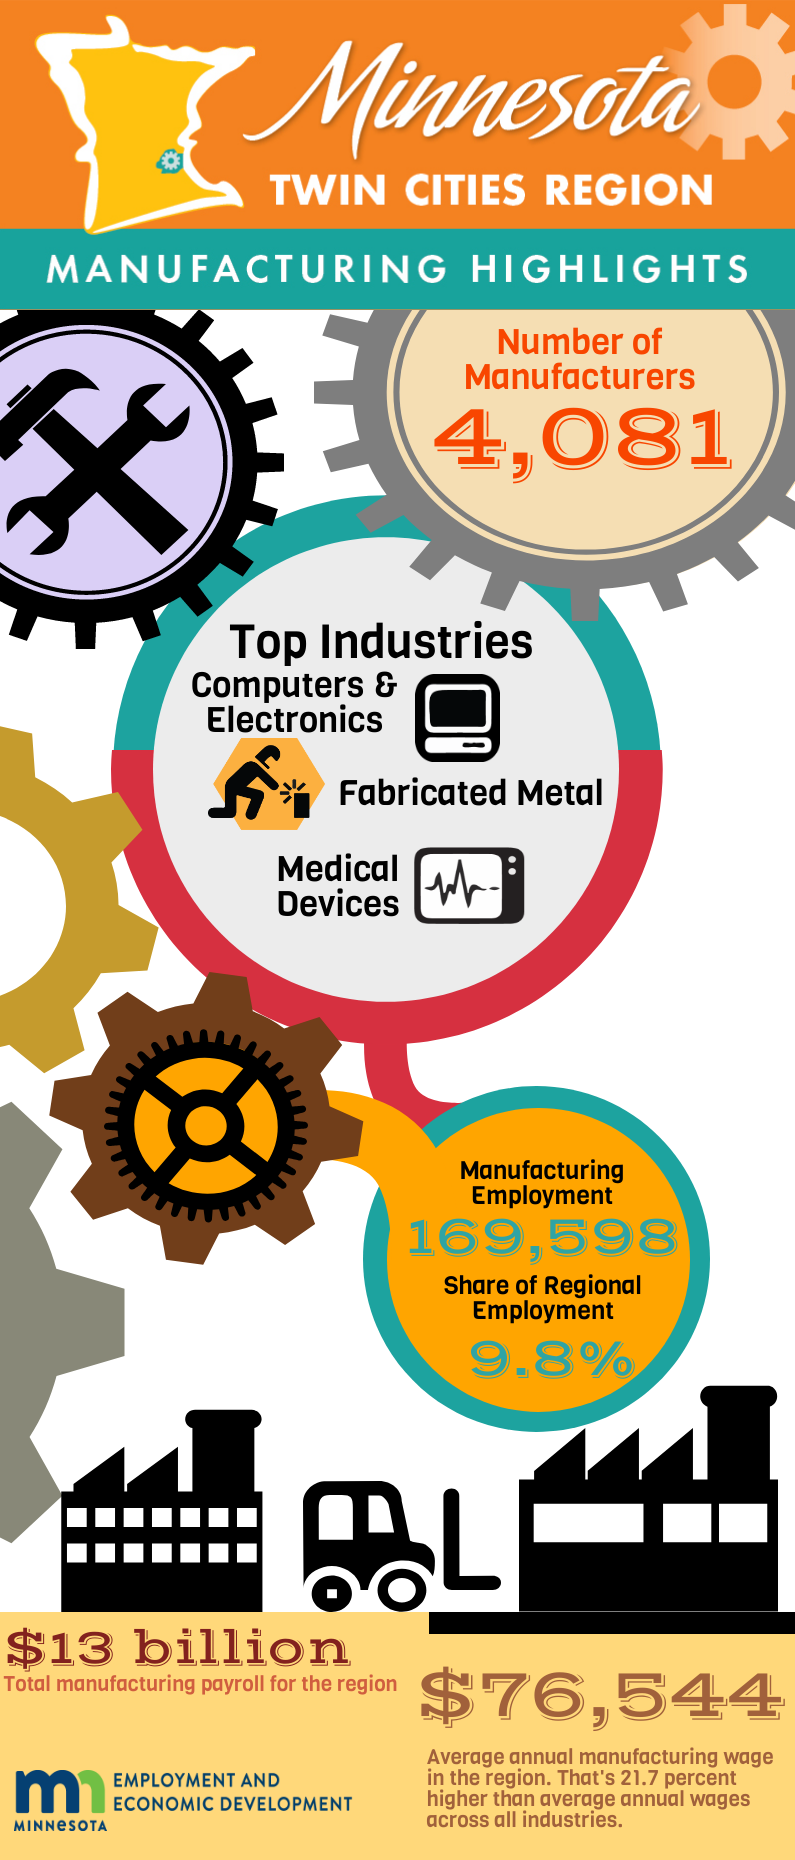
 With 4,081 establishments supplying 169,598 jobs, manufacturing continues to be a vital industry within the seven-county metro area. Manufacturing provides just about one in every ten jobs, making it the region’s second largest-employing industry, behind health care and social assistance.
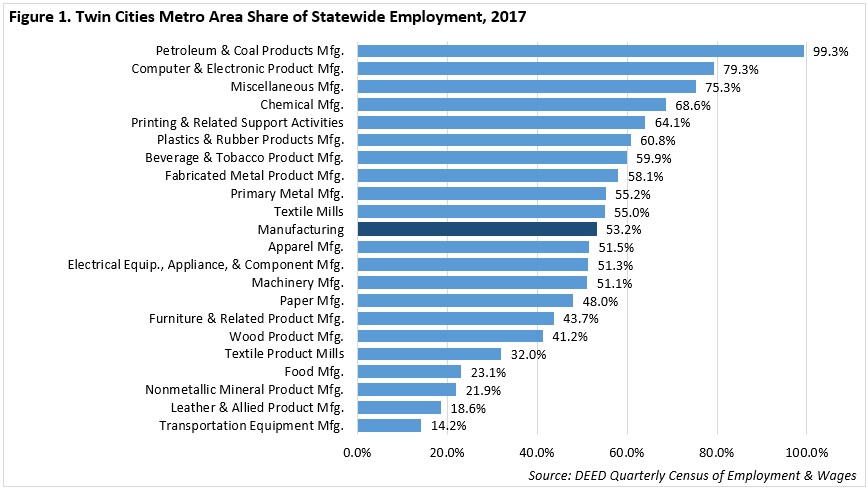
Zooming out, the metro area accounts for just over half (53.2 percent) of the state’s total manufacturing employment. However, knowing that the metro area accounts for 60.9 percent of the state’s total employment across all industries, manufacturing is actually less concentrated here than it is in other regions of Greater Minnesota.
Certain manufacturing subsectors are highly specialized in the metro. With 16 establishments supplying 2,162 jobs, virtually all of the state’s petroleum and coal products manufacturing employment is right within the metro area. With 328 establishments supplying 35,756 jobs, about 80 percent of the state’s huge computer and electronic product manufacturing employment is in the Twin Cities. The region also accounts for over three-quarters of the state’s miscellaneous manufacturing jobs – which includes medical equipment and supplies manufacturing. Lastly, the metro area accounts for almost two-thirds of the state’s employment within both chemical manufacturing and printing and related support activities (Figure 1).

The 2017 Metro Area manufacturing blog post highlighted long-term growth trends within manufacturing. In sum, manufacturing employment in the region did decline steadily between the turn of the century and 2010. Since 2010, however, employment growth has been slow but steady. Between 2010 and 2017, manufacturing employment grew by 8.3 percent, gaining just over 13,000 jobs. Within the last year, between 2016 and 2017, the industry was largely stable, adding 164 jobs.
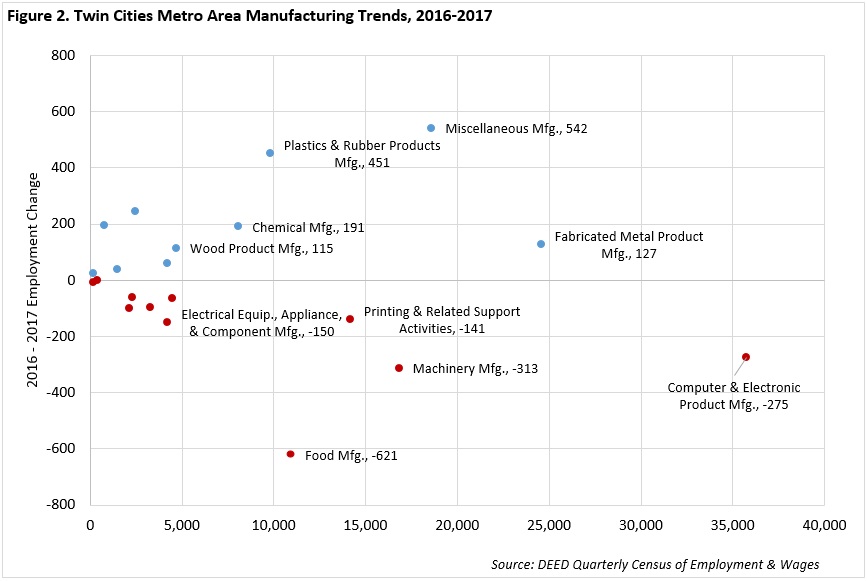
Just as with employment concentration, it’s worth the time to analyze industry trends within specific manufacturing sub-sectors. For example, a number of subsectors gained significant employment between 2016 and 2017, including miscellaneous manufacturing; plastics and rubber products manufacturing; beverage and tobacco product manufacturing; textile product mills; chemical manufacturing; fabricated metal product manufacturing; and wood product manufacturing. Subsectors that lost jobs during that time include food manufacturing; machinery manufacturing; computer and electronic product manufacturing; electrical equipment, appliance, and component manufacturing; and printing and related support activities (Figure 2).

While it is important to analyze annual employment changes for a region there are other considerations, including long-term trends. For example, over-the-year, the computer and electronic product manufacturing subsector lost 275 jobs, but since 2010 it gained 1,334 jobs, which sounds much better for growth. However, this subsector is down 8,077 jobs since 2000, which sounds worse.
Geography is another consideration. At the regional level, printing and related support activities is down 141 jobs. Much of this loss was within Hennepin and Ramsey counties. Meanwhile, Anoka and Scott counties actually gained jobs in this subsector over-the-year.
Finally, it is important to keep an eye on the quality of jobs within manufacturing. One measurement of quality is wages. The average annual wage for manufacturing jobs in the Twin Cities Metro Area is $76,544 – 21.7 percent higher than the average annual wage for the total of all jobs in the metro.
Manufacturing is certainly vital to the Metro Area, and it encompasses many different industries and occupations. You can keep track of manufacturing trends through DEED’s Quarterly Census of Employment and Wages (QCEW) data tool, see where job vacancies are with the Job Vacancy Survey (JVS), look up wages with Occupational Employment Statistics (OES) tool, or even search for and apply for jobs with the Career and Educational Explorer.
Contact Tim O’Neill at 651-259-7401.