 The Minneapolis-St. Paul metropolitan area is a national leader in finance, advanced manufacturing, agriculture and retailing.
Medical devices, electronics and processed foods are strong suits recognized globally.
Want the freshest data delivered by email? Subscribe to our regional newsletters.
12/4/2018 11:00:00 AM
Tim O'Neill
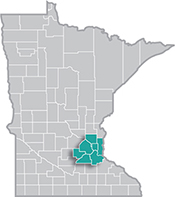
A lot can happen over the course of a year. With 83,763 establishments supplying well over 1.7 million jobs, a lot certainly has happened within the Twin Cities Metro Area’s economy in the past 12 months. DEED’s Quarterly Census of Employment and Wages (QCEW) sheds light on how metro industries are shifting over time, in terms of establishments, employment, total payroll, and average weekly wages.
Here’s the picture in the Metro Area over the course of a year, using the most recent data available, between the second quarters of 2017 and 2018. During that 12-month period, the Metro Area’s total employment expanded by 0.8 percent, adding over 14,600 jobs. Nearly half of this growth was localized to Hennepin County, which gained over 6,700 jobs. However, Carver County grew the fastest, with employment jumping up by 3.8 percent. Scott County saw the fastest growth in new business establishments, but Hennepin again accounted for nearly half the net gain (Table 1).
At a more detailed industry level, 14 of the 20 major industry sectors gained jobs between the second quarters of 2017 and 2018. Health Care and Social Assistance gained nearly 6,000 net new jobs. Professional, Scientific, and Technical Services came in second, adding over 2,200 jobs. Educational Services, Finance and Insurance, Manufacturing, Public Administration, and Accommodation and Food Services each gained over 1,000 jobs. Wholesale Trade, Retail Trade, Other Services, Information, Administrative and Support Services, and Agriculture lost jobs over-the-year (Table 2).
While it’s encouraging to see continued employment increases, this year’s growth was much slower than in recent years. Between 2011 and 2017, the Metro Area averaged annual job growth of 1.7 percent, equivalent to about 28,000 jobs gained each year during that period of time. The cooling period within the past year may be due to a number of factors, including a tight labor market and slowing labor force growth.
Although job growth has cooled, the number of employer establishments has spiked upward. Between the second quarters of 2017 and 2018, the number of establishments across the Metro jumped by 4,464. In the last year, the largest number of new establishments were added within Health Care and Social Assistance; Professional, Scientific, and Technical Services; Other Services; Construction; and Accommodation and Food Services (Table 2).
Many of these job gains have come from business expansions within the past year, which can also be found on DEED’s Publicly Announced Business Expansions tool. Recent announcements in the Metro include:
Combining QCEW data with Publicly Announced Business Expansions gives a unique perspective at just how much the Metro Area has changed over-the-year. In addition, the QCEW data also provides Business Employment Dynamics (BED) data, which measures gross job gains and losses at Minnesota establishments and tracks changes in employment at the establishment level, including establishment openings, closings, expansions, and contractions. Stay tuned for a deeper dive into the region’s shifting employment trends.
Contact Tim O’Neill at 651-259-7401.