 The Minneapolis-St. Paul metropolitan area is a national leader in finance, advanced manufacturing, agriculture and retailing.
Medical devices, electronics and processed foods are strong suits recognized globally.
Want the freshest data delivered by email? Subscribe to our regional newsletters.
5/17/2019 3:00:00 PM
Tim O'Neill
If you’re a frequent user of labor market information, you’re probably not new to the concept of location quotients. For new users, here’s a definition from the Bureau of Labor Statistics (BLS):
Location quotients (LQs) compare the concentration of an industry within a specific area to the concentration of that industry to a base economy [typically the nation]. Essentially, LQs are ratios that allow an area’s distribution of employment by industry, ownership, and class size to be compared to a reference area’s distribution.
For this blogpost, we will be comparing the distribution of the Metro Area’s industry employment to that of Minnesota and the United States.
It should be noted that if an LQ is equal to 1, then the local industry has the same share of its area employment as it does to the base economy. An LQ greater than 1 indicates an industry with a greater share of the local area employment than is the case for the base economy. Generally, LQs greater than or equal to 1.2 are significant.
Now for the Metro Area LQs:

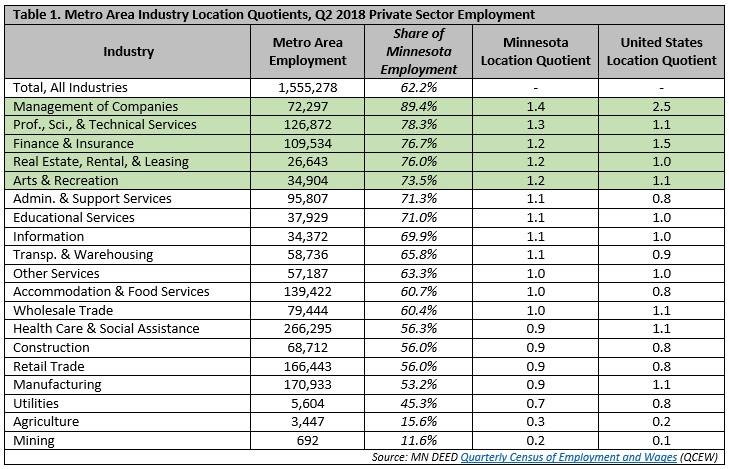
From this list of major industry sectors (NAICS 2-digit industries), we can see that five industries have significant location quotients in the Metro Area when compared to state employment, being Management of Companies; Professional, Scientific, and Technical Services; Finance and Insurance; Real Estate, Rental, and Leasing; and Arts and Recreation. Of these five industries, two have significant location quotients when compared to national employment, those being Management of Companies and Finance and Insurance (Table 1).
Zooming in to NAICS 3-digit industries, those with the highest LQs include:
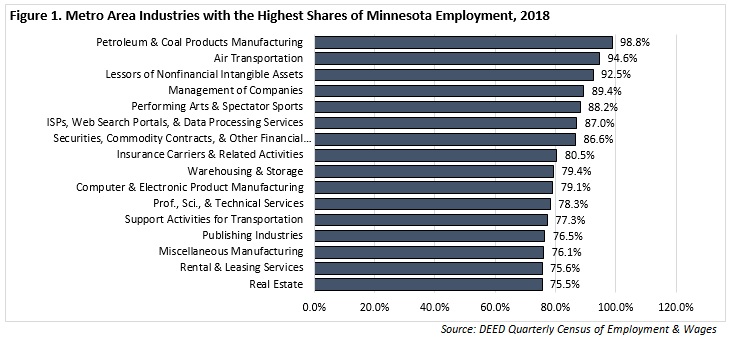
Figure 1 highlights those in-depth industries where the share of statewide employment is highly concentrated in the Metro Area. For example, there were 13,365 jobs in Air Transportation in the Metro Area in Q2 2018, making up nearly 95 percent of such jobs in Minnesota.

Contact Tim O’Neill at 651-259-7401.