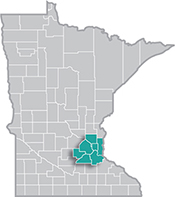
 The Minneapolis-St. Paul metropolitan area is a national leader in finance, advanced manufacturing, agriculture and retailing.
Medical devices, electronics and processed foods are strong suits recognized globally.
Want the freshest data delivered by email? Subscribe to our regional newsletters.
6/21/2019 11:00:00 AM
Tim O'Neill
DEED’s Labor Market Information Office provides a wealth of data people can use to make the most-informed decisions; and these decisions are being made by numerous stakeholders: job seekers, students, entrepreneurs and businesses, school districts, city councils, legislators and policy makers, and others. The Labor Market Information Office is, of course, focused on employment and unemployment, occupational wages, industry trends, projections, and similar data. This data is vital for understanding local and regional areas, and how they fit within the context of Minnesota’s economy, as well as the national economy.
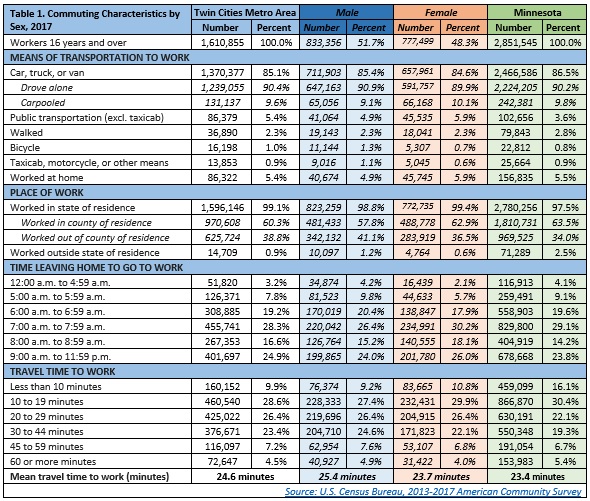
DEED-produced labor market information can be bolstered with external data. A major source of external data is the U.S. Census Bureau’s American Community Survey (ACS). Blogposts and articles written by DEED’s regional analysts often turn to the ACS to build upon labor market analysis. Whether it’s occupational or industry analysis, a look at income or poverty trends, overall population growth, disability statistics, or other topics, the ACS data can provide a more complete understanding of local and regional areas. For example, Table 1 highlights some of the information the ACS provides on commuting characteristics in the Metro Area and Minnesota.

While DEED labor market information focuses in on areas like industry employment and occupational wages, it is important to consider as much information as possible to make the best possible analysis, which will hopefully lead to making the best possible decisions. In the case of commuting data, job seekers can plan how and when they can get to their workplaces accordingly. Employers can begin to answer those all-important questions concerning available talent in their respective areas, and how that talent might commute to their locations. City councils may take a hard look at public transportation, shuttle services, and ease of bicycling in their communities, especially in light of tight labor market conditions. They can use commuting data and labor market information together, and begin to develop creative solutions to issues like an aging labor force or transportation difficulties among low-income populations and persons with disabilities. Beyond national, statewide, and regional data, the ACS allows users to zoom in on zip codes, counties, cities, and even census tracts.
There’s a wealth of information available through the Labor Market Information Office, and even more from sources like the American Community Survey. Keep checking the Metro Local Look blog to discover how this information can be used to discover your local area and region, and adapt to change.
Contact Tim O’Neill at 651-259-7401.