skip to content
Primary navigation

Metro Region

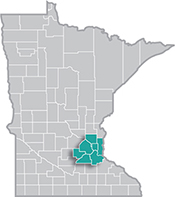
twin-cities-mapThe Minneapolis-St. Paul metropolitan area is a national leader in finance, advanced manufacturing, agriculture and retailing.

Medical devices, electronics and processed foods are strong suits recognized globally.

Want the freshest data delivered by email? Subscribe to our regional newsletters.

A Year in the Twin Cities Metro

10/17/2019 11:00:00 AM

Tim O'Neill

Data, data, and more data. Population statistics, demographic trends, educational attainment, labor force numbers, commuting patterns, household income, cost of living, occupational employment, industry projections, and the list goes on. Each year, DEED’s regional labor market analysts provide an annual update on their respective regions. This year’s comprehensive 2019 Regional Profile for the Twin Cities Metro Area comprises an in-depth look at how the region has changed in recent years, the current state of affairs, and where it might be headed to next.

Here are the highlights:

Population

  • The Seven-County Metro Area now accounts for nearly 3.1 million people, making up over 55 percent of Minnesota’s total population.
  • Since the turn of the century, the Metro Area has added nearly 700,000 people, growing by over 17 percent. Scott County (growing by about 65 percent) and Carver County (growing by about 48 percent) were the region’s fastest-growing counties. Hennepin County was the largest-growing, adding more than 143,000 people between 2000 and 2018.
  • The Metro Area is becoming more diverse. For example, between 2010 and 2018, over 100,000 immigrants moved into the region, most notably from southeastern Asia, south central Asia, eastern Africa, and Latin America.
  • The Metro Area’s population is highly educated. In 2017, almost three-quarters of the region’s population 25 years of age and older had achieved some level of post-secondary education. Over two-in-five residents of the region had a bachelor’s degree or more.

Labor Force

  • Similar to the state, the Metro Area’s labor force growth is slowing down. For example, the region averaged 22,000 new workers per year in the 1990s. This slowed down to an average of 15,000 new workers per year in the 2010s. The region is projected to add an average of 11,000 new workers per year in the 2020s.
  • Unemployment remains low across the region. As of annual 2018, the unemployment rate dipped down to 2.6 percent. This represented about 44,000 unemployed persons, or the lowest unemployment has been in the Metro Area since 2000.
  • The Metro Area had over 76,500 job vacancies during the fourth quarter of 2018, and over 86,000 job vacancies during the second quarter of 2019. As such, there is less than one unemployed person for every job vacancy.

Industry Employment

  • As of 2018, the Seven-County Metro Area had 83,451 establishments supplying 1,761,988 jobs. Employment increased by 22,432 jobs (1.3 percent) between 2017 and 2018, and by 141,376 jobs (8.7 percent) between 2013 and 2018.
  • Hennepin County, adding 11,365 jobs, witnessed the most employment growth over-the-year. Carver County, growing by 3.7 percent, witnessed the fastest employment growth, with Washington County (+2.9 percent) and Anoka County (+2.6 percent) also witnessing rapid growth.
  • Health Care and Social Assistance has added the most jobs over-the-year, followed by Professional, Scientific, and Technical Services; Finance and Insurance; and Construction. Overall, 17 of 20 major industry sectors witnessed employment growth in the region over the past year.

For More Information

Contact Tim O’Neill at 651-259-7401.

back to top