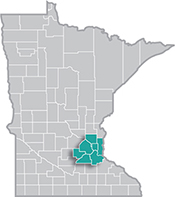
 The Minneapolis-St. Paul metropolitan area is a national leader in finance, advanced manufacturing, agriculture and retailing.
Medical devices, electronics and processed foods are strong suits recognized globally.
Want the freshest data delivered by email? Subscribe to our regional newsletters.
6/22/2020 9:00:00 AM
Tim O'Neill
With the release of April statewide and regional labor force statistics, the impact of COVID-19 on the Seven-County Twin Cities Metro Area is starting to come into focus. Table 1 below highlights two interesting trends: 1) that the unemployment rate increased significantly, and 2) the size of the labor force decreased over-the-year throughout the Metro Area and Minnesota.
In April 2020, all seven counties in the Metro Area experienced sharp increases in unemployment over-the-month and over-the-year. In April 2019, the Metro Area's unemployment rate of 2.7% represented approximately 47,000 unemployed persons. Through March 2020, this had increased slightly to approximately 50,000 unemployed persons, and a 2.9% rate. As of April, with an unemployment rate of 8.9%, the number of unemployed had tripled to over 150,000 persons. For reference, unemployment in the Metro Area peaked at 8.1% during the Great Recession in 2009, which represented approximately 130,000 workers.
Zooming in, unemployment rates were at or above 9% in Ramsey (9.2%), Anoka (9.1%), Scott (9.1%), and Dakota County (9.0%) for April 2020. Unemployment was lowest in the region in Carver County (7.3%), although this rate was still near levels not witnessed since the Great Recession. In addition to sharp increases in unemployment, the Metro Area and Minnesota also witnessed decreasing labor force sizes. Between the Aprils of 2019 and 2020, the Metro Area's labor force size decreased by 0.7%. This was equivalent to approximately 12,700 people. Statewide, the labor force decreased by 1.1%, or approximately 32,900 people. This reflects more people who are neither employed nor actively seeking work. Interestingly, where Carver County had the lowest unemployment rate for April 2020, it also had the largest decrease in labor force size over-the-year (-1.6%) (see Table 1).
| Area | April Labor Force Size | Annual Labor Force Change | April Unemployment Rate – Not Seasonally-Adjusted | ||
|---|---|---|---|---|---|
| 2009 | 2019 | 2020 | |||
| United States | 155,830,000 | -3.9% | 8.6% | 3.3% | 14.4% |
| Minnesota | 3,052,783 | -1.1% | 7.8% | 3.1% | 8.6% |
| Twin Cities Metro Area | 1,701,275 | -0.7% | 7.2% | 2.7% | 8.9% |
| Anoka County | 195,521 | -0.9% | 8.5% | 3.1% | 9.1% |
| Carver County | 57,111 | -1.6% | 7.0% | 2.7% | 7.3% |
| Dakota County | 239,425 | -0.5% | 7.0% | 2.8% | 9.0% |
| Hennepin County | 698,640 | -0.7% | 6.8% | 2.6% | 8.9% |
| Ramsey County | 286,768 | -0.8% | 7.4% | 2.8% | 9.2% |
| Scott County | 82,924 | -0.1% | 7.2% | 2.7% | 9.1% |
| Washington County | 140,886 | -1.1% | 7.2% | 2.8% | 8.2% |
| Source: MN DEED Local Area Unemployment Statistics (LAUS) | |||||
While these are unprecedented highs, they are low in comparison to the national unemployment rate, which hit 14.7% in April 2020. This may be partly due to how local people responded to the survey. The Local Area Unemployment Statistics (LAUS) program provides a very specific definition of unemployed, which might be holding our rate down. According to DEED's LAUS program, "Unemployed persons refers to those not employed but available for work and actively looking during the last four weeks, those waiting to be called back to a job from which they were laid off, or people waiting to report to a new job." As noted, this data is collected by a monthly household survey through the Bureau of Labor Statistics (BLS) and reflects the labor force status every mid-month. May 2020 labor force statistics will be released for the state on June 18th, with regional level data being released on June 23rd.
Contact Tim O'Neill, Labor Market Analyst.