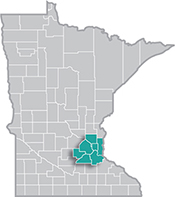
 The Minneapolis-St. Paul metropolitan area is a national leader in finance, advanced manufacturing, agriculture and retailing.
Medical devices, electronics and processed foods are strong suits recognized globally.
Want the freshest data delivered by email? Subscribe to our regional newsletters.
9/9/2020 9:00:00 AM
Tim O'Neill
With the spread of COVID-19, and subsequent pandemic health and safety measures, the Seven-County Twin Cities Metro Area has witnessed an unprecedented spike in Unemployment Insurance (UI) applicants. Between March 16th and August 12th, there were 526,222 UI applicants in the Metro, accounting for three-fifths of the state's total UI applicants during that time. This reflects the enormous strain that both businesses and workers in the region have felt since COVID-19 first made its appearance in the region.
Using DEED's UI Statistics tool, we can begin to understand how COVID-19 has affected the Metro Area's labor market over time. For example, over the past five years, the region averaged 7,300 initial UI claims per month. Initial UI claims include total new and reactivated applications for UI benefits. With 6,793 initial claims for UI in February 2020, the region was still under the five-year average. In March, however, initial claims skyrocketed to 168,704. April increased even further to 190,483. These numbers show how mandatory and voluntary health and safety measures have impacted employment.
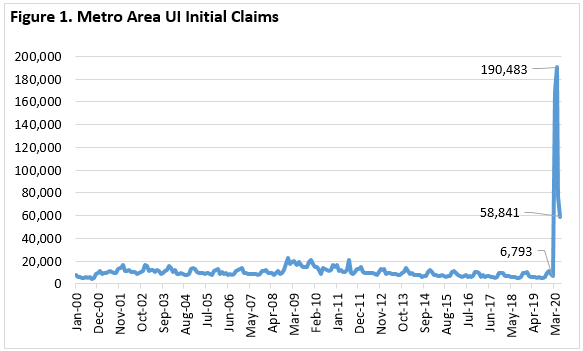
After hitting record highs in March and April, initial UI claims fell significantly in May and June (see Figure 1). This likely reflects the re-opening of many businesses in the region. Even so, the 58,841 initial UI claims in June were 962% higher than they were one year previous. Additionally, there were nearly 205,000 continuing UI claims in June for the Metro Area, a 1,400% increase from one year previous.
In addition to tracking the overall number of UI applicants and continuing claims, we can also analyze the industries, occupations, and demographics of workers receiving unemployment benefits. For example, in March 2020, initial UI claims were overwhelmingly within Accommodation and Food Services, Health Care and Social Assistance, Retail Trade, and Other Services. As of June, the share of UI claims dropped significantly for Accommodation and Food Services, while increasing in Manufacturing and Educational Services. These trends can highlight the ripple effects COVID-19 is making across different parts of the region's labor market.
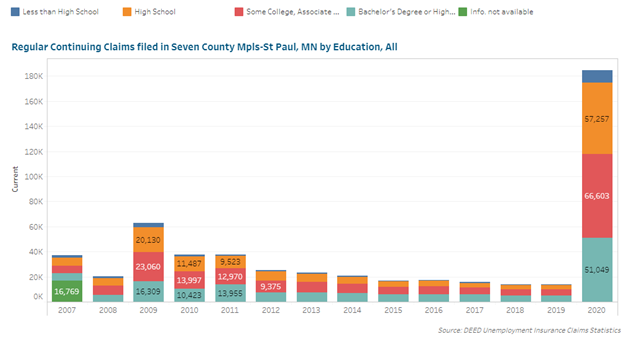
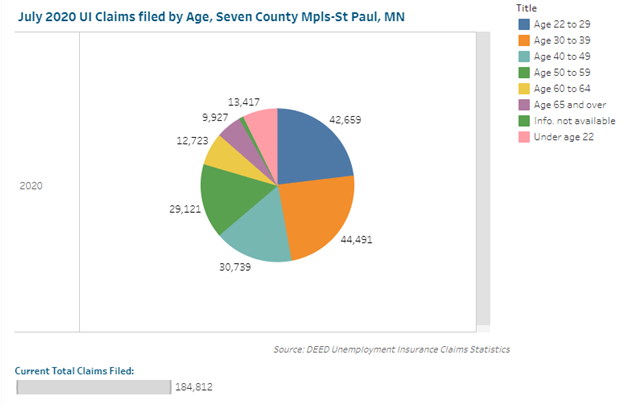
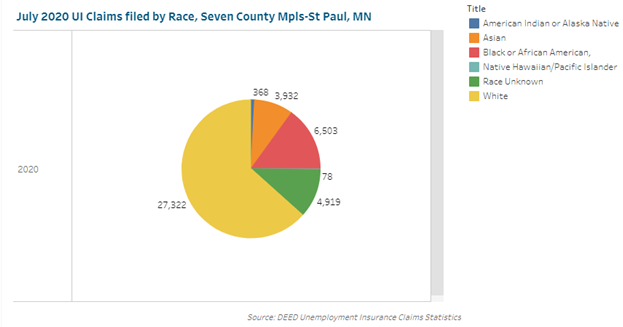
Similarly, when analyzing UI claims by demographics, we can get a better understanding of how different populations are affected. For example, UI claims in the Metro have disproportionately been among those with less educational attainment, those between the ages of 20 and 34 years, and Black, Indigenous and People of Color.
Contact Tim O'Neill, Labor Market Analyst.