 The Minneapolis-St. Paul metropolitan area is a national leader in finance, advanced manufacturing, agriculture and retailing.
Medical devices, electronics and processed foods are strong suits recognized globally.
Want the freshest data delivered by email? Subscribe to our regional newsletters.
4/29/2021 9:00:00 AM
Tim O'Neill
Newly released data from the Department of Employment and Economic Development (DEED) provides the entirety of employment trends for 2020. Using the Quarterly Census of Employment and Wages (QCEW) we can research how different industry sectors fared with the impacts of COVID-19 and the resulting recession. In terms of total employment lost, Accommodation & Food Services was hit the hardest over the course of 2020.
Entering 2020, the Seven-County Metro Area had 6,188 establishments in Accommodation & Food Services supplying nearly 141,100 covered jobs. Over three-fourths (77.8%) of these jobs were within Restaurants. However, due to the coronavirus pandemic, between the second quarters of 2019 and 2020, Accommodation & Food Services lost over 67,400 jobs in the region. This loss of employment was far more than any other major industry sector. In fact, Accommodation & Food Services accounted for more than one-in-four jobs lost in the region during that period. Zooming in, Accommodation lost nearly 10,700 jobs (-62.3%), and Food Services and Drinking Places lost about 56,700 jobs (-45.4%), the vast majority of which were within Restaurants.
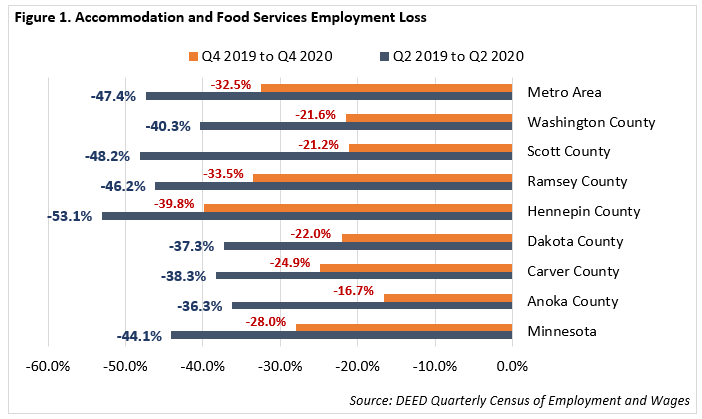
Through the fourth quarter of 2020, Accommodation & Food Services in the Metro Area had regained nearly 20,000 jobs, or 29.4% of total jobs lost between the second quarters of 2019 and 2020. It should be noted that fourth quarter employment for Accommodation & Food Services dipped again from the third quarter due to COVID-19 restrictions put in place during November and December.
By county, losses in Accommodation & Food Services between the second quarters of 2019 and 2020 were most pronounced within Hennepin County (-53.1%), Scott County (-48.2%), and Ramsey County (-46.2%). A special note should be made for Scott County, where Accommodation & Food Services accounted for half (50.2%) of the county's total jobs lost between the second quarters of 2019 and 2020. Fortunately, Scott County witnessed the most robust recovery of such employment lost through the fourth quarter of 2020 (Figure 1).

Accommodation & Food Services employment in the Metro Area has higher shares of younger workers, female workers, workers of color, and workers with less educational attainment than employment across all industries in the region (Table 1). Knowing that Accommodation & Food Services was especially hard-hit during 2020, reveals to an extent why COVID-19's impact upon the Metro Area's labor market has disproportionately been among populations of color, women, younger workers, and those with less educational attainment.
| Seven County Metro Area | Accommodation & Food Services | Total, All Industries |
|---|---|---|
| Total Employment | 137,916 | 1,803,173 |
| Average Annual Earnings | $24,528 | $68,388 |
| Age | ||
| 14-24 years | 45,480 (33.0%) | 225,091 (12.5%) |
| 25-34 years | 33,041 (24.0%) | 415,163 (23.0%) |
| 35-44 years | 23,684 (17.2%) | 401,953 (22.3%) |
| 45-54 years | 16,434 (11.9%) | 356,301 (19.8%) |
| 55-64 years | 12,122 (8.8%) | 307,231 (17.0%) |
| 65 years and over | 7,154 (5.2%) | 97,431 (5.4%) |
| Gender | ||
| Male | 66,236 (48.0%) | 896,410 (49.7%) |
| Female | 71,679 (52.0%) | 906,763 (50.3%) |
| Race and Ethnicity | ||
| White | 104,505 (75.8%) | 1,454,988 (80.7%) |
| Black or African American | 15,207 (11.0%) | 162,361 (9.0%) |
| American Indian or Alaska Native | 1,958 (1.4%) | 12,490 (0.7%) |
| Asian or Pacific Islander | 10,551 (7.7%) | 134,627 (7.5%) |
| Two or More Races | 5,692 (4.1%) | 38,707 (2.1%) |
| Hispanic or Latino (of any race) | 16,751 (12.1%) | 95,768 (5.3%) |
| Educational Attainment (25+) | ||
| Less than High School | 15,761 (17.1%) | 149,022 (9.4%) |
| High School Diploma or Equivalent | 27,751 (30.0%) | 380,379 (24.1%) |
| Some College or Associate Degree | 29,138 (31.5%) | 510,360 (32.3%) |
| Bachelor's Degree or More | 19,785 (21.4%) | 538,320 (34.1%) |
| Source: Quarterly Workforce Indicators (QWI) | ||
Contact Tim O'Neill, Labor Market Analyst.