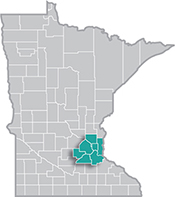
 The Minneapolis-St. Paul metropolitan area is a national leader in finance, advanced manufacturing, agriculture and retailing.
Medical devices, electronics and processed foods are strong suits recognized globally.
Want the freshest data delivered by email? Subscribe to our regional newsletters.
9/1/2021 9:00:00 AM
Tim O'Neill
We last took an in-depth look at the Metro Area's labor force trends back in June 2020, where the data reflected how the region was doing through April 2020. With recently released data for July 2021, we can now see how the region has fared in the 15 months after COVID-19's initial impact upon the labor market.
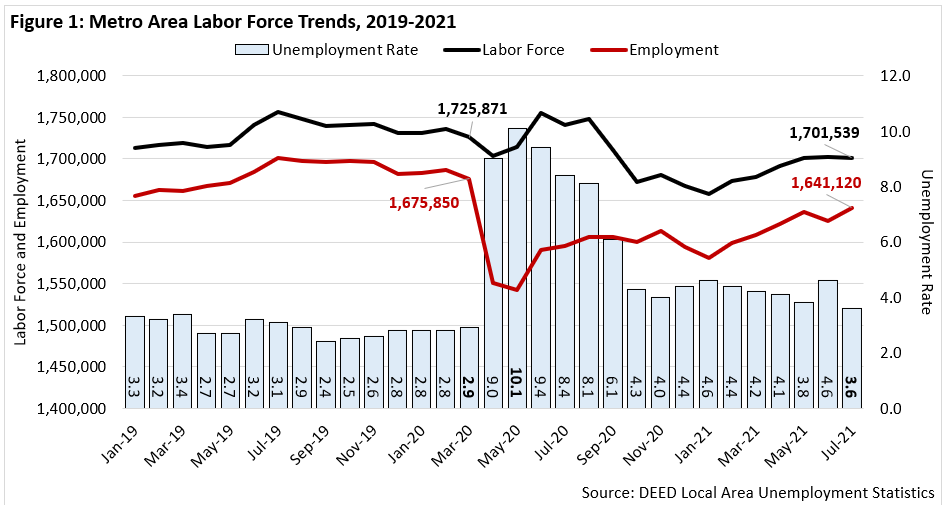
Figure 1 presents us with a high-level view of labor force, employment, and unemployment rate trends in the Metro Area between 2019 and 2021. In that span of time, the pandemic caused massive swings to employment and unemployment in the region, beginning in April 2020. For example, between March and April 2020, the Metro Area's total employment dropped by over 125,200 people (7.5%). Unemployment during that time spiked upwards by over 102,500 people (205.0%). The situation continued to worsen through May 2020, where the unemployment rate topped out at 10.1% (Figure 1).
In July 2021, the Metro Area's unemployment rate dropped back down to 3.6%. While this rate is nearly as low as pre-pandemic levels, it does mask continued shifts in the region's labor force due to COVID. The labor force in July 2021, for example, is still down by over 24,300 people (-1.4%) from March 2020. Broken down, employment during that time is down by over 34,700 people (-2.1%) and unemployment is up by nearly 10,400 people (+20.8%). It is encouraging to see positive labor force trends in the Metro Area over the past year, especially since January 2021, but challenges persist in the region that affect both career-seekers and employers.

Table 1 presents a quick look at labor force statistics for the seven counties of the Metro Area. As of July 2021, unemployment rates ranged from 2.7% in Carver County to 4.1% in Ramsey County.
| Area | Labor Force | Employment | Unemployment | Unemployment Rate | ||
|---|---|---|---|---|---|---|
| July 2021 | May 2020 | February 2020 | ||||
| Metro Area | 1,701,539 | 1,641,120 | 60,419 | 3.9% | 10.1% | 2.8% |
| Anoka County | 195,132 | 188,343 | 6,789 | 3.5% | 9.8% | 3.3% |
| Carver County | 57,963 | 56,402 | 1,561 | 2.7% | 8.1% | 2.8% |
| Dakota County | 238,177 | 230,552 | 7,625 | 3.2% | 10.0% | 2.9% |
| Hennepin County | 700,247 | 674,219 | 26,028 | 3.7% | 10.3% | 2.6% |
| Ramsey County | 285,945 | 274,201 | 11,744 | 4.1% | 10.6% | 2.9% |
| Scott County | 82,571 | 80,067 | 2,504 | 3.0% | 9.9% | 2.9% |
| Washington County | 141,504 | 137,336 | 4,168 | 2.9% | 9.0% | 2.9% |
| Minnesota | 3,050,714 | 2,946,645 | 104,069 | 3.4% | 11.1% | 3.6% |
| United States | 162,817,000 | 153,596,000 | 9,221,000 | 5.7% | 13.0% | 3.8% |
| Source: DEED Local Area Unemployment Statistics (LAUS) | ||||||
Beyond general labor force, employment, and unemployment trends, one should also realize what is actually being measured. For example, the July 2021 unemployment rate of 3.6% in the Metro Area represents the official, or U-3, level of unemployment. There are three additional measurements of unemployment: U-4, U-5, and U-6. These alternative rates of unemployment consider discouraged workers, people who are marginally attached to the labor force, and those people that are working part time for economic reasons, respectively. While alternative measures of unemployment are not available at the local level, such statistics are available at the national and state levels. In Minnesota, the 12-month moving averages for July 2021 were: 4.6% (U-3), 4.8% (U-4), 5.5% (U-5), and 8.0% (U-6). These measurements present a more complete picture of how the state labor market is doing, which can also provide for a greater understanding of the challenges present in regional labor markets.
Contact Tim O'Neill, Labor Market Analyst.