 The Minneapolis-St. Paul metropolitan area is a national leader in finance, advanced manufacturing, agriculture and retailing.
Medical devices, electronics and processed foods are strong suits recognized globally.
Want the freshest data delivered by email? Subscribe to our regional newsletters.
3/11/2022 9:00:00 AM
Tim O'Neill
March is Women's History Month, where the study, observance, and celebration of the vital role of women in American history is commemorated and encouraged. To a similar end, this month we'll study, observe, and celebrate the vital role of women in the Twin Cities Metro Area's labor market.
With DEED's Quarterly Employment Demographics (QED) tool, we can analyze job distribution statistics, median hourly wages, and median hours worked by gender (and by age). This data can be broken down further by geography and industry. This data reveals a near-even split of female and male jobholders in the Twin Cities metro area. A quick look at the major industry sectors, however, reveals several stark differences in gender distribution. Those industries with much higher shares of female-held jobs include Health Care & Social Assistance, Educational Services, Other Services, Finance & Insurance, and Accommodation & Food Services. Meanwhile, those industries with much high shares of male jobholders include Construction, Mining, Transportation & Warehousing, Manufacturing, Wholesale Trade, Information, Administrative Support & Waste Management Services, and Agriculture (Table 1).
Table 1. Twin Cities Metro Area Industry Employment Demographics
| Industry | Q2 2021 Employment Share | Annual 2020 Median Hourly Wage | ||
|---|---|---|---|---|
| Female | Male | Female | Male | |
| Total, All Industries | 50.8% | 49.2% | $22.94 | $27.15 |
| Agriculture | 45.3% | 54.7% | $15.01 | $17.92 |
| Mining | 16.5% | 83.5% | $25.47 | $38.30 |
| Construction | 14.0% | 86.0% | $27.79 | $36.97 |
| Manufacturing | 30.4% | 69.6% | $25.84 | $30.00 |
| Wholesale Trade | 31.1% | 68.9% | $28.02 | $31.12 |
| Retail Trade | 49.9% | 50.1% | $15.27 | $16.73 |
| Transportation & Warehousing | 29.7% | 70.3% | $20.44 | $22.37 |
| Information | 38.3% | 61.7% | $35.35 | $41.77 |
| Finance & Insurance | 55.0% | 45.0% | $35.12 | $45.89 |
| Real Estate & Rental & Leasing | 48.7% | 51.3% | $22.28 | $25.02 |
| Professional & Technical Services | 47.1% | 52.9% | $32.97 | $43.96 |
| Management of Companies | 51.8% | 48.2% | $32.96 | $42.16 |
| Administrative & Waste Services | 44.2% | 55.8% | $17.97 | $18.07 |
| Educational Services | 67.9% | 32.1% | $25.14 | $27.35 |
| Health Care & Social Assistance | 77.0% | 23.0% | $21.62 | $20.06 |
| Arts & Entertainment | 49.2% | 50.8% | $16.16 | $16.22 |
| Accommodation & Food Services | 53.6% | 46.4% | $14.55 | $14.97 |
| Other Services | 58.2% | 41.8% | $18.51 | $22.59 |
| Public Administration | 48.7% | 51.3% | $29.97 | $32.34 |
| DEED Quarterly Employment Demographics | ||||
Zooming in using the QED tool, specific industries with higher shares of female-held jobs include Private Households (86.4% female share of total jobs), Ambulatory Health Care Services (79.3%), Hospitals (78.9%), Personal & Laundry Services (78.2%), Clothing & Clothing Accessories Stores (76.9%), Nursing & Residential Care Facilities (75.5%), Social Assistance (74.1%), Administration of Human Resource Programs (72.2%), Health & Personal Care Stores (71.8%), Apparel Manufacturing (68.6%), Educational Services (67.9%), and Miscellaneous Store Retailers (62.1%).
Meanwhile, those industries where less than one-fifth of total jobs are held by women include Petroleum & Coal Products Manufacturing (8.1% female share of total jobs), Primary Metal Manufacturing (10.9%), Specialty Trade Contractors (11.9%), Heavy & Civil Engineering Construction (12.9%), Leather & Allied Product Manufacturing (13.1%), Truck Transportation (15.0%), Waste Management & Remediation Services (15.6%), Repair & Maintenance (16.1%), Mining (16.4%), Nonmetallic Mineral Product Manufacturing (16.9%), Motor Vehicle & Parts Dealers (18.2%), Fabricated Metal Product Manufacturing (18.9%), and Paper Manufacturing (19.7%).
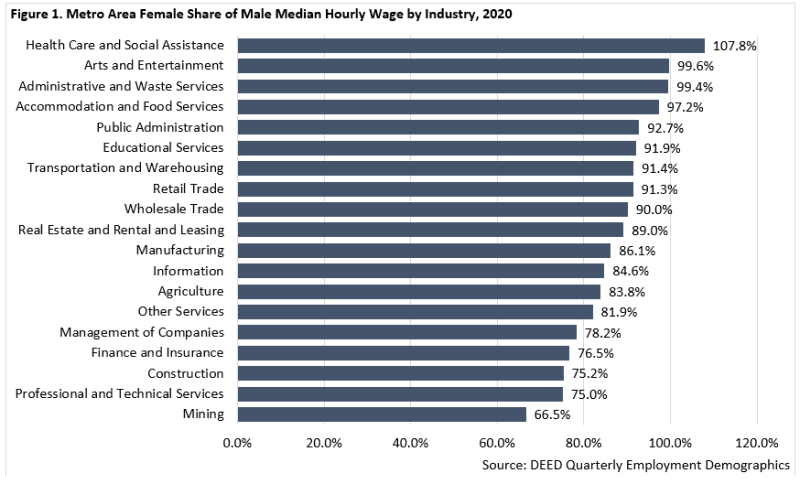
As shown in Table 1, median hourly wages for female workers were approximately 84.5% of what male workers earned across the total of all industries during 2020. Most notably, female workers had higher median hourly wages than their male counterparts in Health Care & Social Assistance, the industry with the highest share of female workers. In addition, there were eight industries where median hourly wages for female workers were between 90% and 100% of male median wages, including Wholesale Trade, Retail Trade, Transportation & Warehousing, Educational Services, Public Administration, Accommodation & Food Services, Administrative Support & Waste Management Services, and Arts & Entertainment. (Figure 1).

Contact Tim O'Neill, Labor Market Analyst.