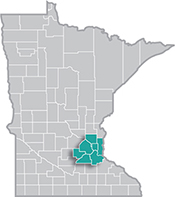
 The Minneapolis-St. Paul metropolitan area is a national leader in finance, advanced manufacturing, agriculture and retailing.
Medical devices, electronics and processed foods are strong suits recognized globally.
Want the freshest data delivered by email? Subscribe to our regional newsletters.
1/11/2023 9:00:00 AM
Tim O'Neill
To start off 2023, let's look at the Metro Area's newest labor force data. Specifically, the demographics of the region's labor force. To do this, we turn to the U.S. Census Bureau's 2021 American Community Survey (ACS) 5-year estimates. Released in December 2022, ACS estimates can provide for an in-depth analysis of labor force statistics by age, race and ethnicity, veteran status, disability status, educational attainment, and more.
According to ACS estimates, the Metro Area had a labor force size of just over 1,777,000 people in 2021, with a labor force participation rate of 71.6%. Labor force participation rates were highest for those in the prime working age cohorts, between the ages of 25 and 54 years. These rates decline significantly for people between the ages of 65 and 74 years, and especially so for those 75 years of age and older as many of these people retire from working. Labor force participation rates are also typically lower for individuals with reported disabilities, as well as those with less educational attainment (Table 1).
| Table 1. Metro Area Labor Force Characteristics, 2021 | ||||
|---|---|---|---|---|
| - | Twin Cities Metro Area | Minnesota Unemployment Rate | ||
| In Labor Force | Labor Force Participation Rate | Unemployment Rate | ||
| Total Labor Force | 1,777,042 | 71.6% | 4.1% | 4.0% |
| 16 to 19 years | 77,028 | 49.6% | 12.7% | 10.7% |
| 20 to 24 years | 156,784 | 83.5% | 7.3% | 6.7% |
| 25 to 44 years | 801,364 | 89.5% | 3.5% | 3.6% |
| 45 to 54 years | 346,192 | 88.1% | 2.9% | 3.0% |
| 55 to 64 years | 304,048 | 74.6% | 3.5% | 3.2% |
| 65 to 74 years | 79,755 | 29.5% | 3.4% | 3.2% |
| 75 years & over | 11,986 | 7.0% | 3.3% | 2.9% |
| Employment Characteristics by Race & Hispanic Origin | ||||
| White alone | 1,359,311 | 71.0% | 3.4% | 3.4% |
| Black or African American | 158,508 | 73.1% | 8.2% | 8.6% |
| American Indian & Alaska Native | 7,508 | 59.7% | 8.4% | 12.9% |
| Asian or Other Pac. Islanders | 133,630 | 73.1% | 4.0% | 4.1% |
| Some Other Race | 45,109 | 77.1% | 6.6% | 6.2% |
| Two or More Races | 73,000 | 76.5% | 7.3% | 7.3% |
| Hispanic or Latino | 108,544 | 78.3% | 6.0% | 6.6% |
| Employment Characteristics by Veteran Status | ||||
| Veterans, 18 to 64 years | 51,020 | 83.3% | 3.9% | 3.9% |
| Employment Characteristics by Disability | ||||
| With Any Disability, 20 to 64 years | 85,732 | 55.5% | 10.3% | 9.9% |
| Employment Characteristics by Educational Attainment | ||||
| Population, 25 to 64 years | 1,451,321 | 85.6% | 3.4% | 3.4% |
| Less than H.S. Diploma | 67,144 | 67.1% | 4.7% | 4.6% |
| H.S. Diploma or Equivalent | 225,235 | 77.9% | 2.8% | 2.5% |
| Some College or Assoc. Degree | 417,748 | 85.5% | 4.1% | 3.6% |
| Bachelor's Degree or Higher | 741,791 | 90.7% | 2.2% | 2.1% |
| Source: U.S. Census Bureau, American Community Survey 5-Year Estimates | ||||
Over time, unemployment rates in the Metro Area and Minnesota are significantly higher for teenagers, as well as younger adults between the ages of 20 and 24 years. Disparities are also present when analyzing unemployment by race and ethnicity. For example, those reporting as American Indian and Alaska Native and Black or African American have unemployment rates above 8.0%, which was nearly two and a half times the white unemployment rate in the region.
Keeping a close eye on labor force statistics can help to understand where disparities and challenges exist in the labor market. Such statistics can be tracked over time, too, to see if such disparities and challenges are improving or becoming more significant.
Contact Tim O'Neill, Labor Market Analyst, at timothy.oneill@state.mn.us