 The Minneapolis-St. Paul metropolitan area is a national leader in finance, advanced manufacturing, agriculture and retailing.
Medical devices, electronics and processed foods are strong suits recognized globally.
Want the freshest data delivered by email? Subscribe to our regional newsletters.
8/22/2023 9:00:00 AM
Tim O'Neill
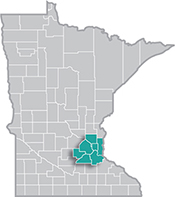
Recently, the Minnesota Department of Employment & Economic Development (DEED) released 1st quarter 2023 employment data through the Quarterly Census of Employment & Wages (QCEW). QCEW data provides industry employment and wage information at the state, regional, and county level, including all establishments covered under the Unemployment Insurance (UI) program. As such, we can get a look at how the Seven-County Metro Area's employment is trending in recent years. This is especially insightful as the region continues to recover from the COVID-19 recession in 2020.
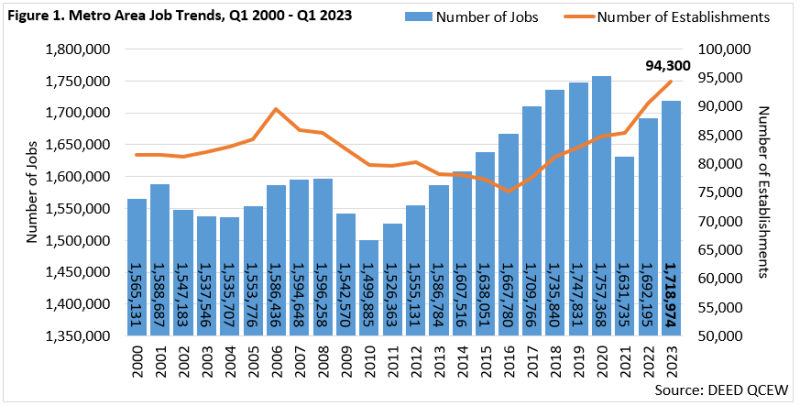
According to DEED's QCEW data, the Metro Area had 94,300 establishments supplying 1,718,974 covered jobs during 1st quarter 2023. As Figure 1 shows, the region was up 26,779 jobs (+1.6%) from 1st quarter 2022 and up 87,239 jobs (+5.3%) from 1st quarter 2021. However, the region is still down 38,394 jobs (-2.2%) from 1st quarter 2020. In other words, the Metro Area has regained about 70% of the more than 125,600 jobs it lost between the first quarters of 2020 and 2021, and still has some distance to go to get back to pre-pandemic employment levels (Figure 1).

In all, the Metro Area has about 38,400 jobs to gain to match the pre-COVID levels of employment it had during 1st quarter 2020. The bulk of the region's employment losses have been felt in Hennepin and Ramsey counties. Hennepin County must regain over 32,100 jobs to reach 1st quarter 2020 levels of employment while Ramsey County must gain 11,600 jobs. Dakota County must recover nearly 4,900 jobs to reach pre-COVID levels of employment. Meanwhile, Scott County, Washington County, Anoka County, and Carver County are all now above their respective 1st quarter 2020 levels of employment. In fact, at just over 4,300 jobs above its pre-COVID level of employment, Scott County has gained the most jobs of any county in Minnesota between the first quarters of 2020 and 2023 (Table 1).
| Table 1. Metro Area Job Change by County, Q1 2020 – Q1 2023 | ||||
|---|---|---|---|---|
| Area | Number of Establishments | Number of Jobs | Q1 2020 – Q1 2023 Job Change | |
| Numeric | Percent | |||
| Minnesota | 207,623 | 2,835,269 | -20,797 | -0.7% |
| Metro Area | 94,300 | 1,718,974 | -38,394 | -2.2% |
| Hennepin County | 44,777 | 898,953 | -32,151 | -3.5% |
| Ramsey County | 15,461 | 318,874 | -11,600 | -3.5% |
| Dakota County | 11,740 | 182,913 | -4,873 | -2.6% |
| Anoka County | 8,676 | 129,501 | +2,137 | +1.7% |
| Washington County | 6,840 | 90,876 | +2,974 | +3.4% |
| Scott County | 3,938 | 57,599 | +4,302 | +8.1% |
| Carver County | 2,868 | 40,256 | +817 | +2.1% |
| Source: DEED Quarterly Census of Employment and Wages | ||||
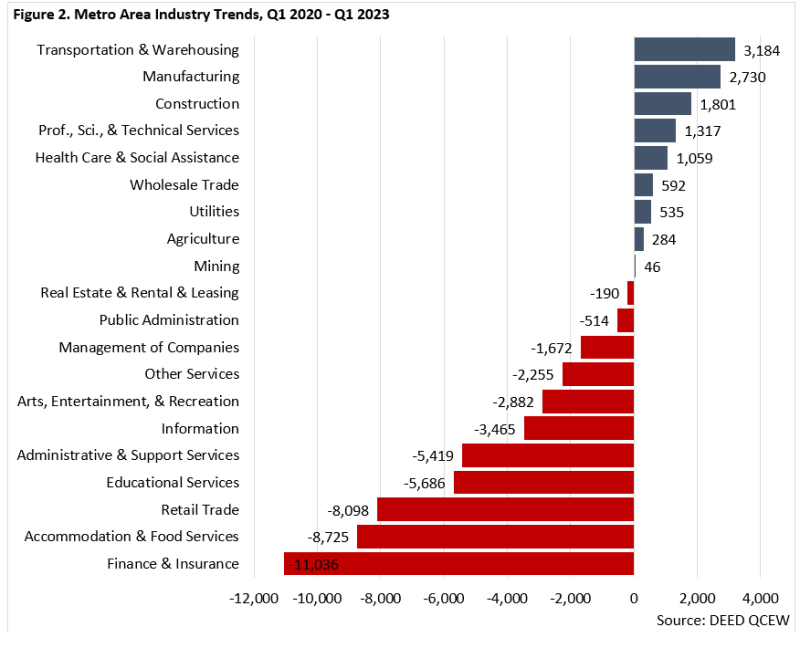
At an industry level, Finance & Insurance (-11,036 jobs), Accommodation & Food Services (-8,725 jobs), and Retail Trade (-8,098 jobs) are the three industries with the most employment loss between the 1st quarters of 2020 and 2023. Educational Services (-5,686 jobs) and Administrative Support & Waste Management Services (-5,419 jobs) are also significantly below their respective pre-COVID levels of employment. Meanwhile, Transportation & Warehousing (+2,730 jobs), Manufacturing (+2,730 jobs), and Construction (+1,801 jobs) have experienced the most employment growth since 1st quarter 2020. Overall, nine major industries in the Metro Area are above their respective pre-COVID levels of employment, while 11 are still below (Figure 2).

Contact Tim O'Neill, Labor Market Analyst, at timothy.oneill@state.mn.us.