 The Minneapolis-St. Paul metropolitan area is a national leader in finance, advanced manufacturing, agriculture and retailing.
Medical devices, electronics and processed foods are strong suits recognized globally.
Want the freshest data delivered by email? Subscribe to our regional newsletters.
10/27/2023 9:00:00 AM
Tim O'Neill
The Metro Area Local Look recently highlighted the importance of Manufacturing to the region's labor market and economy, timed along with the celebration of Manufacturing Month in October. As the Metro Area's second largest-employing industry sector, with about 175,000 jobs, Manufacturing deserves the spotlight once more. This time around the light will shine on Manufacturing demographics and how the industry is becoming more diverse with time.
According to data from the U.S. Census Bureau's Quarterly Workforce Indicators (QWI), the Metro Area had 173,815 Manufacturing jobs in 2022. Just over three-quarters (76.0%) of these jobs were held by workers reporting as white, with the remaining quarter (24.0%) held by workers reporting as a race other than white. Comparatively, about one-fifth (20.4%) of jobs across all industries in the Metro Area were held by workers reporting as a race other than white.
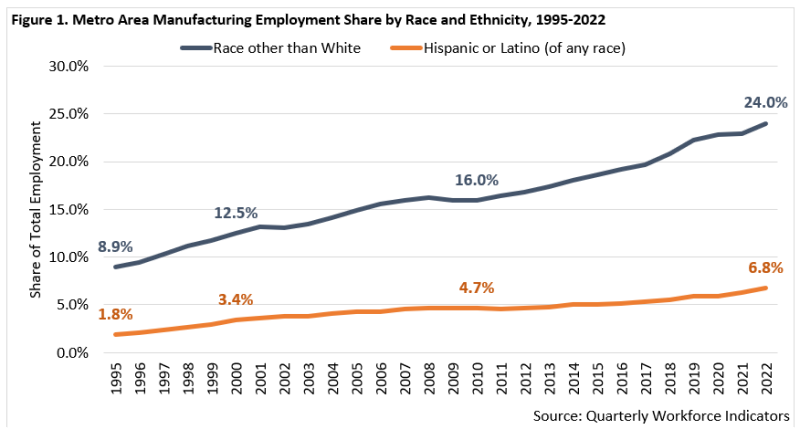
Over time, Manufacturing employment in the Metro Area has become more racially diverse. Less than 9% of Manufacturing jobs were held by workers reporting as a race other than white in 1995, which nearly doubled through 2010 to 16.0%. Over the past decade of available data, between 2012 and 2022, total Manufacturing employment in the Metro Area increased by 5.4% (+8,835 jobs). But where the number of Manufacturing jobs held by white workers decreased by -3.8% (-5,216 jobs), the share of jobs held by workers reporting a race other than white increased by 50.7% (+14,051 jobs). At the same time, the number of Manufacturing jobs held by workers reporting Hispanic or Latino origin increased by 54.4% (+4,151 jobs) (Figure 1).

Zooming in on race, 14.7% of the Metro Area's Manufacturing jobs in 2022 were held by Asian or Other Pacific Islanders (25,512 jobs), 7.0% were held by Black or African Americans (12,093 jobs), 1.8% were held by workers reporting Two or More Races (3,088 jobs), and 0.6% were held by American Indian or Alaska Natives (1,063 jobs). Between 2012 and 2022, Manufacturing jobs held by Asian or Other Pacific Islanders increased the most (+7,585 jobs; +42.3%), while jobs held by Black or African Americans increased the fastest during that period (+5,012 jobs; +70.8%). Manufacturing jobs held by workers reporting Two or More Races increased by 66.0% (+1,228 jobs) between 2012 and 2022, and jobs held by American Indian and Alaska Natives increased by 27.5% (+229 jobs).
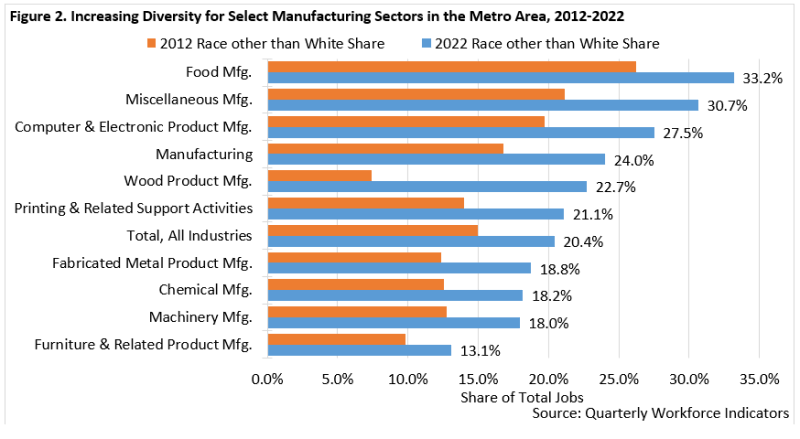
The QWI data also allows for a finer level of analysis with specific industry sectors. While data for the Metro Area is only available for nine specific Manufacturing sectors at this level of analysis, we can see how each of these sectors has become more diverse over the past decade. For example, about one-third (33.2%) of Food Manufacturing jobs in the Metro Area are held by workers reporting as a race other than white. This was up from 26.3% in 2012. Meanwhile, the share of Wood Product Manufacturing jobs held by workers reporting as a race other than white increased from 7.4% in 2012 to 22.7% in 2022. The nine specific Manufacturing sectors highlighted in Figure 2 represented 80.8% of the region's total Manufacturing employment in 2022.

Data from the U.S. Census Bureau's QWI tool also allows users to analyze industry employment by age, gender, and educational attainment.
Contact Tim O'Neill, Labor Market Analyst, at timothy.oneill@state.mn.us.