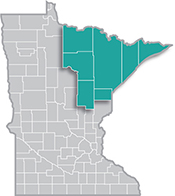
 Home to the state's second-largest metro, the Northeast Region has a strong industrial sector, tied largely to the area's abundant natural resources.
Most of the manufacturing base centers on mining and forest products industries. More than half of the sector's employment is in paper and machinery manufacturing.
Want the freshest data delivered by email? Subscribe to our regional newsletters.
11/27/2017 12:04:56 PM
Erik White
October’s release of Local Area Unemployment Statistics (LAUS) showed historically low unemployment rate estimates for the Arrowhead region. Northeast Minnesota has a 3.2 percent unemployment rate while the city of Duluth is at 2.5 percent and Workforce Service Area 3 (7-county Arrowhead region minus the city of Duluth) is at 3.5 percent. Unemployment rates ranged from a low of 2.0 percent in Cook County to 4.7 percent in Koochiching County (Table 1). Unemployment rates this low have not been recorded this century in the region, and further indicate the tightening of the labor market in the region.

Due to the seasonal nature of the economy in the region, September and October tend to have the lowest unemployment rates for the year. But the recent drop is larger than normal. The unemployment rate in the region fell two percentage points from last year’s 5.2 percent and has dropped nearly 5 percentage points since October 2009 (Figure 1).

While low unemployment rates are welcomed by workers, rates this low could indicate challenges ahead for businesses. There were an estimated 5,200 unemployed workers in the region in October, but the latest release of the Job Vacancy Survey had nearly 10,000 job openings in the region for the second quarter of 2017. This indicates a very tight labor market as the number of job seekers per vacancy slipped below 1.0 this summer (Figure 2).

In the face of this tight labor market, attraction and retention are key as the supply of labor is limited and job seekers have more options to choose from when deciding where to apply or work.
Contact Erik White at 218-302-8413.
