skip to content
Primary navigation

Northeast Region

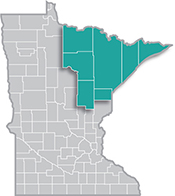
northwest-minnesota-mapHome to the state's second-largest metro, the Northeast Region has a strong industrial sector, tied largely to the area's abundant natural resources.

Most of the manufacturing base centers on mining and forest products industries. More than half of the sector's employment is in paper and machinery manufacturing.

Want the freshest data delivered by email? Subscribe to our regional newsletters.

A Rising Tide Lifts Most Boats, Part 2

4/3/2019 4:00:00 PM

Cameron Macht

As detailed in last month’s Local Look blog, incomes were climbing across the Northeast region. Though the rising tide seems to be lifting all boats, there was still a lot of variation by race or origin. Even though it was one of the smallest groups in terms of population, and therefore the margins of error are larger, Asian households reported the highest median household income in Northeast Minnesota at $54,669 in 2017. That was narrowly ahead of the median incomes for white households, which was around $52,700. Black or African American households reported the lowest median incomes, equaling less than one-third of the comparable income for whites (Figure 1).
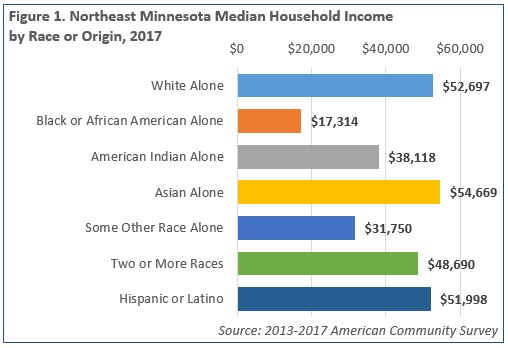
Figure 1. Northeast Minnesota Median Household Income by Race or Origin, 2017

Incomes were also significantly lower for American Indians and households of some other race. While typically lower, the silver lining is that incomes rose faster for households of all other race groups than for whites over the past year, including twice as fast for Black or African Americans and six times as fast for American Indians. While it helped close the gap, the gaps are still significant. Margins of error come into play for some of the smaller areas and populations – but the data clearly shows that incomes are lower for other race groups.

Over half of households of some other race and nearly two-thirds of black or African American households in the region reported incomes below $25,000 in the most recent American Community Survey estimates, while over 50 percent of American Indian, Asian, Hispanic or Latino, and households of two or more races had incomes below $50,000 in 2017 (Figure 2).
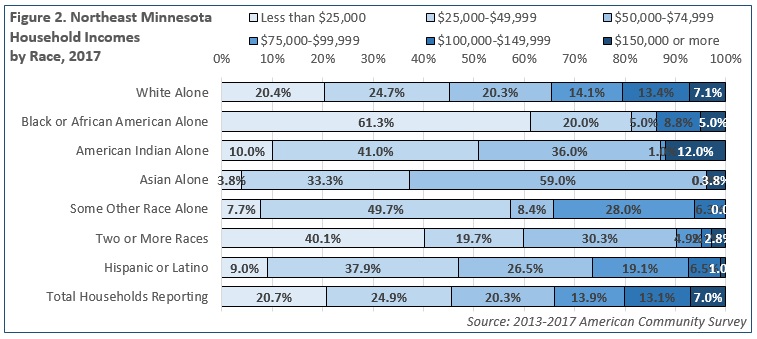
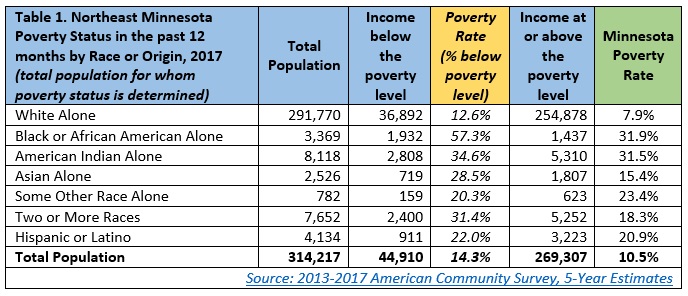
Figure 2. Northeast Minnesota Household Incomes by Race, 2017

Poverty rates also vary widely by race and origin within the region, with whites posting the lowest rates and black or African Americans and American Indians reporting the highest rates. Though the margins of error are much larger in Northeast Minnesota, so are the gaps between whites and residents of other races (Table 1).

Table 1. Northeast Minnesota Poverty Status in the past 12 months by Race or Origin, 2017 (total population for whom poverty status is determined)

Using data from the Census Bureau’s 2013-2017 American Community Survey five-year estimates, DEED created an interactive visualization that provides details on median incomes at the household, family, married couple family, and non-family household levels. This data shows how the Arrowhead compares to other regions of the state, and also provides estimates on the percentage of households falling into each income category, from less than $15,000 to more than $200,000.

Median Household Income, 2017

For More Information

Contact Cameron Macht at 320-441-6596.

back to top