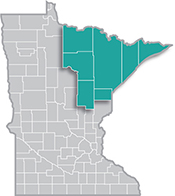
 Home to the state's second-largest metro, the Northeast Region has a strong industrial sector, tied largely to the area's abundant natural resources.
Most of the manufacturing base centers on mining and forest products industries. More than half of the sector's employment is in paper and machinery manufacturing.
Want the freshest data delivered by email? Subscribe to our regional newsletters.
9/9/2020 9:00:00 AM
Carson Gorecki
Disparities in workforce outcomes are exacerbated by economic stresses such as recessions. Monthly unemployment claims from DEED's Unemployment Insurance (UI) Statistics lay bare how the current coronavirus crisis is widening the gap in employment between white workers and Black, Indigenous and People of Color (BIPOC) workers in Northeast Minnesota.
It is important to understand that racial and ethnic employment disparities existed prior to the pandemic. In 2018, according to the U.S. Census Bureau's American Community Survey (ACS), the average unemployment rate in Northeast Minnesota was 5.1%. However, the unemployment rate for BIPOC workers was uniformly higher than that of white workers. In fact, workers identifying as Two or More Races were more than twice as likely and American Indians were more three times as likely to be without work. With the exception of Black workers, these disparities are greater in the Northeast Region than in the rest of the state (Table 1).
| Table 1. Employment Characteristics by Race & Hispanic Origin, 2018 | |||||
|---|---|---|---|---|---|
| Northeast Minnesota | Minnesota | ||||
| In Labor Force | Labor Force Partic. Rate | Unemp. Rate | Labor Force Partic. Rate | Unemp. Rate | |
| Total Labor Force | 162,659 | 60.4% | 5.1% | 69.7% | 3.9% |
| White alone | 152,356 | 60.6% | 4.7% | 69.5% | 3.3% |
| Black or African American | 1,533 | 46.9% | 6.9% | 70.7% | 9.9% |
| American Indian & Alaska Native | 3,746 | 58.8% | 14.6% | 58.5% | 12.8% |
| Asian or Other Pac. Islanders | 1,403 | 59.3% | 7.7% | 71.3% | 4.7% |
| Some Other Race | 431 | 59.2% | n/a | 77.2% | 6.2% |
| Two or More Races | 3,215 | 62.5% | 12.2% | 73.1% | 7.6% |
| Hispanic or Latino | 2,150 | 63.8% | 7.2% | 76.3% | 6.5% |
| Source: U.S. Census American Community Survey, 2014-2018 5-Year Estimates | |||||
DEED's UI Statistics provide unemployment claims by type of claim, occupational group, industry, and most importantly for this analysis, demographic groups. Regular and continued claims are the measure of ongoing weekly requests for unemployment benefits and are useful in showing who is remaining unemployed in a region. We can use the UI statistics to examine unemployment trends in greater detail and compare groups over time.
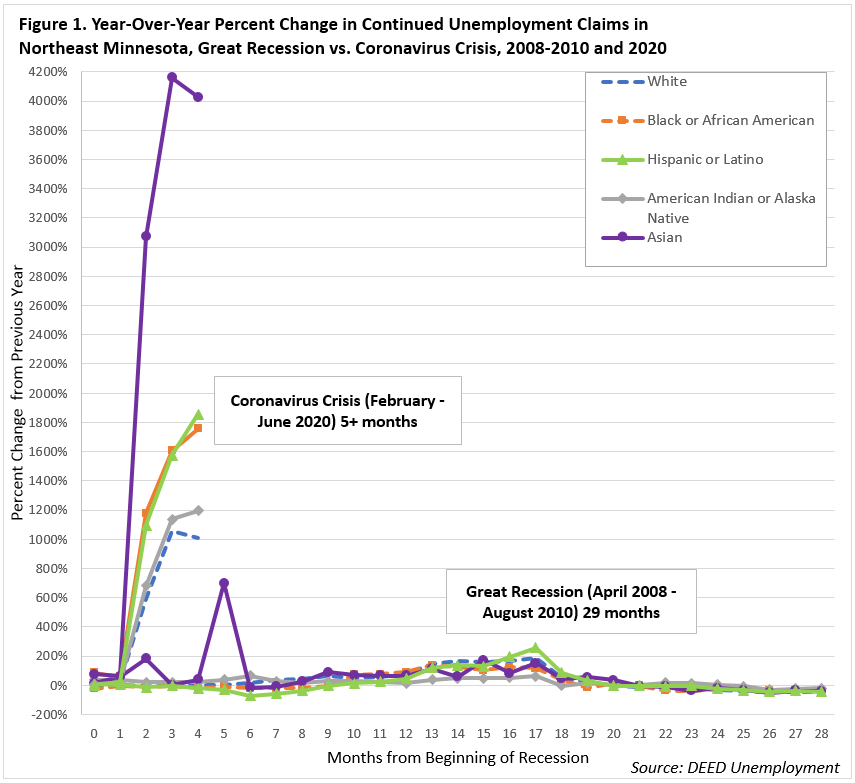
The coronavirus pandemic is not like previous recessions. Unlike the Great Recession which occurred more gradually over multiple years, the current employment crisis began very suddenly and job loss occurred at a much greater magnitude. These differences are easily discernible in Figure 1, which compares the annual change in monthly continued unemployment claims. In other words, it compares the number of continued unemployment claims in a current month to the number of continued unemployment claims in the same month in the previous year.
Also noticeable in Figure 1 are the enormous disparities among the region's racial and ethnic groups. During the Great Recession, the difference in unemployment claims for white workers tracked somewhat consistently with the percent changes in unemployment claims for workers of color. At the peak of the Great Recession, some 17 months in, only Hispanic or Latino workers had a greater percent change from the previous year.
However, in the coronavirus crisis, the number of Asian workers filing unemployment claims in May and June of 2020 was more than 40 times greater than in 2019, and more than double the percent change of any other group. And while the percent change begins to fall into June for Asian and white workers, claims continued to climb relative to 2019 for American Indians, Black or African Americans, and Hispanic or Latino workers. The disparity for many workers of color continued to grow. As the recession continues, these disparate outcomes will require direct consideration, if all are to benefit from the recovery that follows.

Contact Northeast Minnesota Labor Market Analyst Carson Gorecki at 218-302-8413.