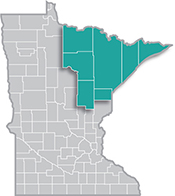
 Home to the state's second-largest metro, the Northeast Region has a strong industrial sector, tied largely to the area's abundant natural resources.
Most of the manufacturing base centers on mining and forest products industries. More than half of the sector's employment is in paper and machinery manufacturing.
Want the freshest data delivered by email? Subscribe to our regional newsletters.
6/8/2021 9:00:00 AM
Carson Gorecki
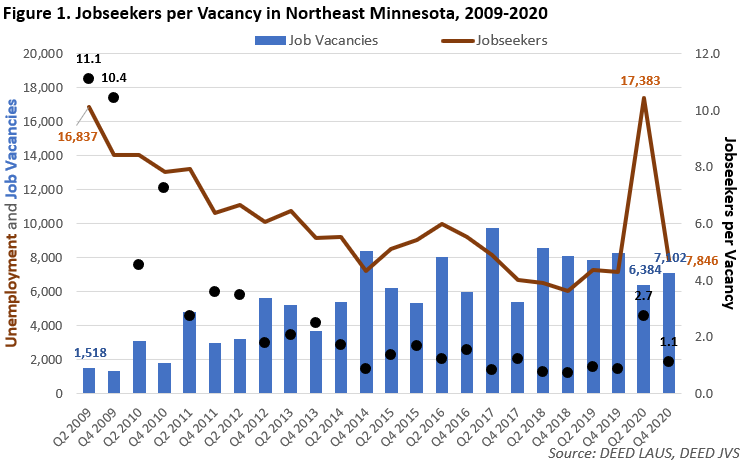
There were 7,102 job vacancies in Northeast Minnesota in the fourth quarter of 2020, a 14.2% decline from the end of 2019. Despite this decline, the number of vacancies remained relatively high. The number of vacancies in the fourth quarter of 2020 was fourth-highest out of the last ten years. This is not typical during recessionary periods - the number of job vacancies coming out of the Great Recession in 2011 was less than half of the current number and unemployment was significantly higher.
For additional context we can compare the number of job vacancies to the number of unemployed workers, who by definition are active job seekers. In the years leading up to the pandemic, the ratio of job seekers to job vacancies was below one, indicating high demand for workers. During the Great Recession, the number of job seekers per vacancy soared above 10 as hiring slowed significantly. Low demand for workers has not been a problem in the region in recent months. By the end of 2020, the number of jobseekers per open position returned to 1.1 as the labor market reverted to the tightness that existed from 2018 through the beginning of 2020 (see Figure 1).

The largest share of job vacancies in the fourth quarter of 2020 were in Sales & Related occupations with 16.5% of all openings in the region. Food Preparation & Serving Related openings represented 15.3% and Healthcare Support and Healthcare Practitioners combined for another 23.9% of quarterly vacancies.
Installation, Maintenance, & Repair vacancies increased the most over the year, driven by openings for Automotive Service Technicians & Mechanics. Healthcare Support and Management vacancies also saw large increases over the year, with growth in the former likely reflecting the continued high demand for Home Health & Personal Care Aides and Nursing Assistants. Notably, vacancies in occupational groups hit hardest during the pandemic such as Food Preparation & Serving Related and Arts, Design, & Entertainment saw increased vacancies compared to the previous year, even as public health restrictions were increased during the fourth quarter.
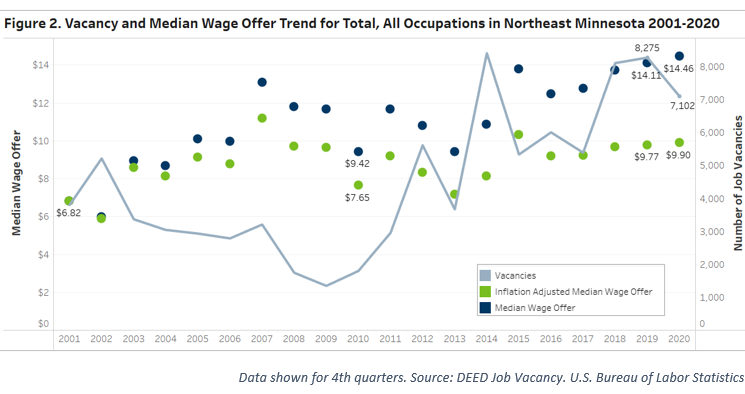
The median wage offer for job vacancies in the fourth quarter of 2020 was $14.46 an hour. This is the highest median wage offer since the survey began in 2001. However, a better measure of wage growth accounts for inflation. The inflation-adjusted median wage offer was $9.90 an hour in Northeast Minnesota. That may not seem like much, but in 2001 dollars – the base year for the adjustment – the current median offer represents a 45.2% increase in real wages (see Table 1).
| Occupational Group | 2020 Q4 Vacancies | Percent Change in Vacancies 2019-2020 | 2020 Median Wage Offer | Inflation Adjusted Median Wage Offer | 2001 Median Wage Offer | Percent Growth of Inflation Adjusted Median Wage Offer 2001-2020 |
|---|---|---|---|---|---|---|
| Arts, Design, Entertainment, Sports, and Media | 122 | 64.9% | $20.94 | $14.33 | $6.00 | +139% |
| Protective Service | 112 | 89.8% | $17.88 | $12.24 | $5.38 | +127% |
| Construction and Extraction | 59 | -76.9% | $24.13 | $16.51 | $7.31 | +126% |
| Personal Care and Service | 213 | -65.5% | $17.04 | $11.66 | $5.48 | +113% |
| Sales and Related | 1,170 | -15.4% | $13.40 | $9.17 | $5.15 | +78% |
| Business and Financial Operations | 16 | -78.7% | $26.67 | $18.25 | $10.54 | +73% |
| Production | 69 | -2.8% | $16.10 | $11.02 | $7.00 | +57% |
| Food Preparation and Serving Related | 1,084 | 1.4% | $11.90 | $8.14 | $5.38 | +51% |
| Total, All Occupations | 7,102 | -14.2% | $14.46 | $9.90 | $6.82 | +45% |
| Architecture and Engineering | 26 | -82.8% | $33.65 | $23.03 | $16.10 | +43% |
| Life, Physical, and Social Science | 40 | 73.9% | $31.68 | $21.68 | $15.74 | +38% |
| Healthcare Practitioners and Technical | 940 | -23.3% | $27.63 | $18.91 | $14.30 | +32% |
| Building and Grounds Cleaning & Maintenance | 311 | -39.4% | $13.55 | $9.27 | $7.17 | +29% |
| Computer and Mathematical | 34 | -77.8% | $25.41 | $17.39 | $13.50 | +29% |
| Installation, Maintenance, and Repair | 400 | 566.7% | $16.00 | $10.95 | $8.71 | +26% |
| Healthcare Support | 757 | 118.2% | $13.42 | $9.18 | $8.46 | +9% |
| Office and Administrative Support | 576 | -19.6% | $13.50 | $9.24 | $8.61 | +7% |
| Educational Instruction and Library | 235 | -20.9% | $16.44 | $11.25 | $11.23 | 0% |
| Management | 273 | 100.7% | $27.36 | $18.72 | $20.72 | -10% |
| Community and Social Service | 333 | 9.9% | $12.48 | $8.54 | $9.49 | -10% |
| Transportation and Material Moving | 320 | -54.3% | $14.75 | $10.09 | $11.33 | -11% |
| Source: DEED Job Vacancy Survey, U.S. Bureau of Labor Statistics | ||||||
Driving the wage growth were the lowest-paying occupations such as Arts, Design, Entertainment, Sports, & Media; Protective Service, and Personal Care & Service. However, these groups were hit hard during the pandemic and do not have a higher number of openings, even if wages are higher.
Only three occupations did not see their inflation adjusted median wage offers grow from 2001. The median wage offers of Management, Community & Social Service, and Transportation & Material Moving each decreased by around 10% compared to inflation. Educational Instruction & Library also saw their wages stagnate from 2001 to 2020.
The change in real wage offers for all occupations has not been a steady increase year-over-year. Wage offers fluctuated noticeably in relation to minimum wage increases and large economic disruptions such as the Great Recession (See Figure 2). The current pandemic recession has not seemed to impact median wage offers in a significant way. Real wage offers for all vacancies increased $0.13 over the year.

Data shown for fourth quarters. Source: DEED Job Vacancy. U.S. Bureau of Labor Statistics
And while the number of vacancies fell compared to last year, they remain relatively high, especially in comparison to the supply of workers. If trends continue, the tight labor market conditions Northeast Minnesota was experiencing before the pandemic are likely right around the corner.
Contact Northeast Minnesota Labor Market Analyst Carson Gorecki at 218-302-8413.