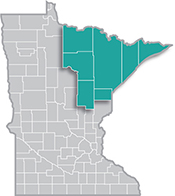
 Home to the state's second-largest metro, the Northeast Region has a strong industrial sector, tied largely to the area's abundant natural resources.
Most of the manufacturing base centers on mining and forest products industries. More than half of the sector's employment is in paper and machinery manufacturing.
Want the freshest data delivered by email? Subscribe to our regional newsletters.
2/14/2023 9:00:00 AM
Anthony Schaffhauser
Four times a year we get new data from our Quarterly Census of Employment and Wages (QCEW) program, the best source for industry employment and wage figures across the state. QCEW data are derived from the filings that businesses are required to report under the Unemployment Insurance Program. Most recently, we published data for the third quarter of 2022. This article will discuss some of the highlights for Northeast Minnesota.
As of the third quarter of 2022, Northeast Minnesota was home to 138,486 jobs across 9,236 establishments. Compared to pre-pandemic levels, there were 6,508 fewer jobs, a 4.5% decline over 3 years. Compared to other planning regions, this was the largest percent decline by a considerable margin, and the third-largest numeric decline, despite the region having the smallest number of jobs(Table 1).
| Table 1. Employment by Planning Region, Qtr. 3 2019 – Qtr. 3 2022 | ||||
|---|---|---|---|---|
| Region | Number of Jobs, Qtr. 3 2019 | Number of Jobs, Qtr. 3 2022 | 2019-2022 Numeric Employment Change | 2019-2022 Percent Employment Change |
| Minnesota | 2,916,985 | 2,880,239 | -36,746 | -1.3% |
| Central Minnesota | 280,629 | 276,722 | -3,907 | -1.4% |
| Northeast Minnesota | 144,994 | 138,486 | -6,508 | -4.5% |
| Northwest Minnesota | 227,590 | 226,332 | -1,258 | -0.6% |
| Southeast Minnesota | 248,200 | 241,436 | -6,764 | -2.7% |
| Southwest Minnesota | 176,626 | 171,903 | -4,723 | -2.7% |
| Twin Cities Metro | 1,780,901 | 1,736,824 | -44,075 | -2.5% |
| Source: MN DEED Quarterly Census of Employment & Wages | ||||
While overall employment in the region was down, there was significant variation by sector. The largest numeric losses occurred in Health Care & Social Assistance and Accommodation & Food Services (see Figure 1). However, the largest percent losses occurred in Information, Transportation & Warehousing, Mining, and Other Services, all of which declined more than 10% from 2019 (see Figure 2).
Information has been in a long term decline, while Mining has been more volatile and is down largely due to recent layoffs at one firm. Transportation & Warehousing and Other Services employment fell more in direct response to pandemic-related impacts limiting travel and personal interaction that many Other Services industries consist of. Specifically impacted were Civic & Social Organizations and Personal Care Services. An exception to the declines within Transportation & Warehousing was Couriers and Messengers, which grew 20.8% over three years in response to increased demand for delivery services.
On the growth side were Construction (+5.4%) and Professional, Scientific, & Technical Services (+4.6%), which were the only two sectors to add jobs over the three-year period. These two sectors are closely related and were likely buoyed by several large-scale construction projects that occurred in the region and were for the most part undeterred by the pandemic.

Interestingly, the negative trend on employment did not translate into fewer businesses. In fact, there were 368 establishments added over three years, a 4.1% increase. The number of establishments in the region grew over each year between 2019 and 2022. The largest net increase in establishments occurred in Other Services (+111), Health Care & Social Assistance (+86), and Construction (+78). Sixty-five of the over 100 new establishments in Other Services were added between 2021 and 2022, perhaps hinting that confidence in the sector is beginning to return.
Six sectors saw net declines of establishments, but only Retail Trade saw a loss greater than four, losing 51 establishments over three years. The trend of more businesses but fewer jobs means that the average business size has fallen from 16.4 employees per site in third quarter 2019 to 15.0 in third quarter 2022.
Lastly, the "W" in QCEW stands for "wages", the other important piece of what businesses contribute as part of their UI reporting. From third quarter 2019 to third quarter 2022 average weekly wages were up 24.3%. However, since the number of pay periods is not consistent across quarters, this increase may not be representative. Averaged across the first three quarters of each year to account for this, average wages still increased 18.6%. The largest percent increases occurred in some of the sectors with already high wages: Finance & Insurance (+31.9%), Management (+30.6%), and Mining (30.2%).
A second tier of above average wage growth occurred in Accommodation & Food Services (+23.6%), Retail Trade (+22.1%), Health Care & Social Assistance (+21.7%), and Arts, Entertainment & Recreation (+20.9%). This second group included many of the sectors most impacted early in the pandemic. The smallest increases were in Utilities (+3.4%), Agriculture, Forestry, Fishing, & Hunting (+5.9%), and Information (+6.2%). Over the last year, wages increased an average of 7.7%, led by Mining (+16.8%), Finance & Insurance (+15.9%), Real Estate Rental & Leasing (+11.2%), and Health Care & Social Assistance (+11.0%).
QCEW data is a vital and accurate source of information as we track the continued and evolving recovery of the economy in Northeast Minnesota and the rest of the state. Stay tuned for the next quarterly update!
Contact Carson Gorecki, Labor Market Analyst, at carson.gorecki@state.mn.us.
