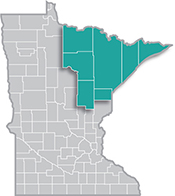
 Home to the state's second-largest metro, the Northeast Region has a strong industrial sector, tied largely to the area's abundant natural resources.
Most of the manufacturing base centers on mining and forest products industries. More than half of the sector's employment is in paper and machinery manufacturing.
Want the freshest data delivered by email? Subscribe to our regional newsletters.
5/10/2023 9:00:00 AM
Carson Gorecki
Layoffs in the "Big Tech" sector have been in the news the last couple of months as companies that responded to booming demand for products and services during the pandemic begin to readjust back to previous employment levels. Nationwide, Computer & Mathematical occupations account for 3.4% of total jobs. In Minnesota, the tech-centric occupational group accounted for a slightly larger 3.5% share of total jobs. The states (and territories) with the highest concentrations of tech workers include Washington D.C., Virginia, Washington, Maryland, and Colorado. Interestingly, California, sometimes known as the "birthplace" of high tech and home to Silicon Valley, is the state with the 8th highest location quotient for Computer & Mathematical occupations. Minnesota ranks 15th highest.
Northeast Minnesota, despite having the second lowest number of Computer & Mathematical jobs among Minnesota regions, has the third highest concentration behind only the Twin Cities Metro and Southeast (see Table 1).
| Table 1. Minnesota Computer & Mathematical Occupational Group Jobs by Region, 2023 | |||
|---|---|---|---|
| Area | Jobs | Share of Total Employment | Location Quotient |
| Minnesota | 99,250 | 3.5% | |
| Twin Cities Metro | 78,440 | 4.6% | 1.30 |
| Southeast Minnesota | 4,280 | 1.8% | 0.52 |
| Northeast Minnesota | 2,150 | 1.6% | 0.45 |
| Northwest Minnesota | 2,480 | 1.1% | 0.33 |
| Central Minnesota | 3,020 | 1.1% | 0.32 |
| Southwest Minnesota | 1,770 | 1.1% | 0.30 |
| Source: DEED Occupational Employment & Wage Statistics | |||
These jobs, while relatively few, tend to be high-paying and require higher levels of education or training. Most Computer & Mathematical occupations require at least a bachelor's degree. In Northeast Minnesota, the median wage hourly for Computer & Mathematical occupations was $39.38, nearly $17 higher than the overall median wage and the second highest among occupational groups. On an annual basis, that's nearly $35,000 higher!
Expanding the tech definition beyond just the Computer & Mathematical occupational group, computer and information occupations is a slightly broader categorization that includes some additional jobs that can also be considered "high tech." Table 2 lists the most common computer and information occupations in Northeast Minnesota.
However, even this expanded category will not capture all technology-related jobs and it is increasingly the case that most jobs have high tech tasks, responsibilities, or components. A popular notion is that most of these jobs are at quintessential tech companies such as Amazon, Google, Microsoft, or Facebook. However, the distribution of computer and information jobs in Minnesota may be more varied than you think.
| Table 2. Top Computer & Information Occupations Employment & Wage Statistics in Northeast Minnesota, 2023 | ||
|---|---|---|
| Occupation | Employment | Median Wage |
| Software Developers | 570 | $103,048 |
| Computer Systems Analysts | 320 | $87,134 |
| Computer User Support Specialists | 370 | $56,023 |
| Computer Network Support Specialists | 240 | $70,683 |
| Network & Computer Systems Administrators | 150 | $84,539 |
| Computer & Information Systems Managers | 150 | $124,758 |
| Computer Numerically Controlled Tool Operators | 130 | $47,806 |
| Computer Occupations, All Other | 120 | $88,171 |
| Computer Programmers | 70 | $86,909 |
| Web Developers | 50 | $73,900 |
| Information Security Analysts | 40 | $101,675 |
| Database Administrators | 40 | $83,696 |
| Web & Digital Interface Designers | 40 | $63,337 |
| Computer Hardware Engineers | 30 | $104,448 |
| Computer Network Architects | 30 | $92,966 |
| Computer Science Teachers, Postsecondary | 40 | $86,171 |
| Software Quality Assurance Analysts & Testers | 20 | $75,320 |
| Computer Numerically Controlled Tool Programmers | 30 | $61,859 |
| Database Architects | N/A | N/A |
| Top Computer & Information Occupations Total | 2,440 | $84,000 |
| Source: DEED Occupational Employment & Wage Statistics | ||
The computer and information occupations listed in Table 2 are concentrated in four industries. The Professional, Scientific & Technical Services, Finance & Insurance, Manufacturing, and Management of Companies industries provide employment for just under two-thirds of these computer and information jobs. Some of these industries may come as no surprise, but Manufacturing, which was in the past more associated with dirty, loud factories than high tech workplaces, is an industry that is increasingly embracing technology such as automation and robotics. Postsecondary instructional programs including robotic welding, integrated manufacturing technology, and computer numerically controlled (CNC) technician are offered across the state to meet the increased need for highly-skilled production workers.
Looked at a different way, computer and information jobs make up the largest share of the Information industry's total employment, followed by Professional, Scientific & Technical Services, and Management of Companies. Each of these industries has more than 10% of their workforce in occupations that could be deemed high tech. Professional, Scientific & Technical Services employment is highly concentrated in the Twin Cities Metro, but Northeast Minnesota has the second highest concentration with 3.5% of regional employment.
Given that the Professional, Scientific & Technical Services sector has the highest share of computer and information technology jobs, the two employment categories tend to reflect each other. More detailed industries with the highest shares of computer and information jobs are Computer Systems Design and Related Services (59.9%), Software Publishers (44.0%), Data Processing, Hosting, and Related Services (35.3%), and Computer and Peripheral Equipment Manufacturing (22.9%).
| Table 3. Estimated Computer & Information Employment Shares by Industry, 2022 | ||
|---|---|---|
| Industry | Northeast Minnesota Employment | Share of Industry Employment (Statewide) |
| Total All Industries | 134,073 | 3.7% |
| Information | 1,088 | 18.5% |
| Professional, Scientific & Technical Services | 4,650 | 17.2% |
| Management of Companies & Enterprises | 730 | 12.3% |
| Finance & Insurance | 3,903 | 9.0% |
| State Government, Excluding Education & Hospitals | 5,083 | 6.5% |
| Manufacturing | 8,736 | 4.9% |
| Utilities | 1,462 | 4.6% |
| Wholesale Trade | 2,881 | 4.6% |
| Administrative Support & Waste Management Services | 3,198 | 3.2% |
| Educational Services | 11,399 | 2.2% |
| Transportation & Warehousing | 3,790 | 1.1% |
| Source: DEED Quarterly Census of Employment & Wages, Occupational Employment & Wage Statistics | ||
Technology is increasingly infused into the fabric of all jobs, yet the occupations most connected with the "high tech" label remain concentrated in a few industries. As the proliferation of technology continues throughout the workforce, we can expect the distribution of tech jobs to equalize across industries even further.
Contact Carson Gorecki, Labor Market Analyst, at carson.gorecki@state.mn.us.
