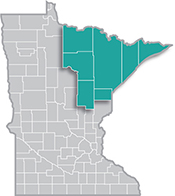
 Home to the state's second-largest metro, the Northeast Region has a strong industrial sector, tied largely to the area's abundant natural resources.
Most of the manufacturing base centers on mining and forest products industries. More than half of the sector's employment is in paper and machinery manufacturing.
Want the freshest data delivered by email? Subscribe to our regional newsletters.
10/27/2023 9:00:00 AM
Carson Gorecki
To celebrate National Hispanic Heritage month, here is a brief profile of the Hispanic or Latino workforce in Northeast Minnesota. The story of many Hispanic or Latino residents in the state and region began with migration, often in search of work. While most opted for areas to the south or west in the state, Northeast Minnesota has a small but increasing Hispanic or Latino population.
 As of 2021, there were 5,817 residents of the region identifying as Hispanic or Latino, a 142% increase from 2000 and a 55% increase from 2010. More than half of the Hispanic or Latino population in the region has Mexican heritage and about half were born in Minnesota. Of the other half, two-thirds were born in another state and moved to Minnesota, while the remainder were born in other countries and migrated to our region (see Figure 1).
Over the last decade, the region's Hispanic or Latino population has been growing faster when compared to the state over the same period. Despite this fast rate of growth, Hispanics or Latinos accounted for just 2% of the Northeast population, compared to 5.6% of the population statewide.
Historically, Hispanics or Latinos have higher than average labor force participation. In Northeast Minnesota, the Hispanic or Latino labor force participation rate (63.1%) was more than 3.5 percentage points higher than the overall participation rate (59.5%). Largely for this reason, the number of jobs held by Hispanics or Latinos in Northeast Minnesota rose even faster than the Hispanic or Latino population over the past two decades. This employment growth also outpaced overall regional employment growth (see Figure 2). As of 2022, Hispanic or Latino employment accounted for 2.2% of all jobs.

Statewide, Hispanic or Latino workers account for the largest shares of Farming Fishing, & Forestry (26%), Food Prep & Serving (14%), and Production occupational employment (12%)1. Farming is much less common in Northeast, meaning that Hispanic or Latino workers are more likely to be employed in other occupations and industries. Indeed, according to the U.S. Census Bureau's Quarterly Workforce Indicators program, the sector employing the most Hispanic or Latino workers in Northeast Minnesota is also the largest sector overall: Health Care & Social Assistance.
After Health Care, which employs one out of five Hispanic or Latino jobholders, the next largest sectors of employment are Accommodation & Food Services (15%), Transportation & Warehousing (14%), and Retail Trade (12%). Those four sectors combine to account for 61% of Hispanic or Latino employment in the region. Hispanic or Latino workers make up the largest shares of sector employment in Transportation & Warehousing (4.9%), Accommodation & Food Services (3.4%), and Arts, Entertainment & Recreation (2.8%) (see Table 1).
| Table 1. Hispanic or Latino Employment by Sector in Northeast Minnesota 2022 | ||
|---|---|---|
| Industry Sector | Employment | Share of Sector Employment |
| Health Care & Social Assistance | 613 | 1.8% |
| Accommodation & Food Services | 472 | 3.4% |
| Transportation & Warehousing | 424 | 4.9% |
| Retail Trade | 359 | 2.4% |
| Educational Services | 183 | 1.5% |
| Construction | 149 | 1.9% |
| Public Administration | 114 | 1.3% |
| Professional, Scientific, & Technical Services | 111 | 1.9% |
| Other Services | 111 | 2.2% |
| Manufacturing | 102 | 1.3% |
| Arts, Entertainment, & Recreation | 94 | 2.8% |
| Admin. Support & Waste Management Services | 87 | 2.4% |
| Mining, Quarrying, & Oil & Gas Extraction | 70 | 1.8% |
| Wholesale Trade | 58 | 1.9% |
| Finance & Insurance | 52 | 1.5% |
| Real Estate & Rental & Leasing | 33 | 2.2% |
| Information | 21 | 2.1% |
| Utilities | 14 | 0.8% |
| Source: Quarterly Workforce Indicators | ||
If trends persist, we can expect the Hispanic or Latino population and workforce to continue to grow in Northeast Minnesota. And if you are curious and want to learn more about the Hispanic or Latino Minnesotans, I recommend the Minnesota Council on Latino Affairs' demographic and socioeconomic report: "A Portrait of Hispanic/Latinx in Minnesota" and DEED's own report on Hispanic or Latino Minnesotans.
1https://data.census.gov/table?q=B24010i+mn
Contact Carson Gorecki, Labor Market Analyst, at carson.gorecki@state.mn.us.
