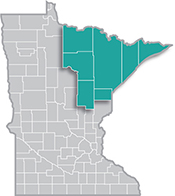
 Home to the state's second-largest metro, the Northeast Region has a strong industrial sector, tied largely to the area's abundant natural resources.
Most of the manufacturing base centers on mining and forest products industries. More than half of the sector's employment is in paper and machinery manufacturing.
Want the freshest data delivered by email? Subscribe to our regional newsletters.
11/27/2023 9:00:00 AM
Carson Gorecki
The Retail Trade sector employed nearly 17,000 people at 1,250 establishments in Northeast Minnesota in the first half of 2023. That's enough to make it the second largest employing sector in the region, behind only Health Care & Social Assistance. The Retail Trade sector is engaged in selling goods to the general public. Businesses in the sector sell a wide array of goods, anything from food and beverages to furniture, clothing, cars, stationary, and much more.
The largest industries within the larger Retail Trade sector in 2023 were General Merchandise Retailers, Food & Beverage Stores, Gasoline Stations & Fuel Dealers and Motor Vehicle & Parts Dealers, each with more than 2,000 jobs (see Table 1). Those four industries accounted for 66% of jobs in the region's Retail Trade sector. Sector employment levels through the first two quarters of 2023 effectively matched those of 2019, showing that the Retail Trade sector proved more resilient to the impacts of the COVID-19 pandemic than most industries. The more than 1,100 jobs that were lost in the immediate outbreak have been recovered over the last three years. By comparison, total employment across all industries remains over 6,000 (-4.2%) jobs below 2019 levels.
| Table 1. Northeast Minnesota Retail Sector Employment and Wage Statistics, Q1 & Q2 2023 | ||||
|---|---|---|---|---|
|
Industry |
Number of Jobs | Number of Firms | Average Annual Wage | Workers per Establishment |
| Total, All Industries | 137,016 | 9,274 | $55,146 | 14.8 |
| Retail Trade | 16,927 | 1,261 | $32,682 | 13.4 |
| General Merchandise Retailers | 3,388 | 94 | $29,588 | 36.2 |
| Food & Beverage Stores | 3,174 | 164 | $26,130 | 19.4 |
| Gasoline Stations & Fuel Dealers | 2,533 | 235 | $29,614 | 10.8 |
| Motor Vehicle & Parts Dealers | 2,057 | 148 | $51,324 | 13.9 |
| Building Material & Garden Equipment & Supplies Dealers | 1,949 | 121 | $37,284 | 16.2 |
| Sporting Goods, Hobby, Musical Instrument, Book, & Miscellaneous Retailers | 1,492 | 220 | $23,374 | 6.8 |
| Health & Personal Care Retailers | 892 | 85 | $42,016 | 10.6 |
| Clothing, Clothing Accessories, Shoe, & Jewelry Retailers | 810 | 109 | $21,814 | 7.4 |
| Furniture, Home Furnishings, Electronics, & Appliance Retailers | 633 | 87 | $42,354 | 7.3 |
| Source: DEED Quarterly Census of Employment and Wages | ||||
Within the General Merchandise Retailers industry, Warehouse Clubs, Supercenters & Other General Merchandiser Retailers had 2,337 jobs and Department Stores had another 1,051 jobs. These larger employers averaged over 36 employees per establishment, more than double the sector average of 13.4 workers. Department Stores in the region averaged 117 workers each. The Retail businesses with the smallest average staffs were Office Supplies, Stationary & Gift Retailers (3.8), Other Miscellaneous Retailers (4.1), and Jewelry, Luggage & Leather Good Retailers (5.4). Compared to all industries, which had 14.8 employees per establishment, Retail establishments tended to be smaller.
Retail workers were paid an average annual wage of $32,682 in first and second quarter of 2023. That was about $23,500 less than the average for all industries in the region. Part of that discrepancy is simply lower wages in the sector, but it also can be attributed to the part-time nature of many Retail Trade jobs. In 2022, the median hours worked per week by employees in the Retail Trade sector was 23.6, compared to 30.1 for all industries. Median hourly wages were also lower in Retail Trade ($16.15) than all industries ($22.44). Wages were still lower despite growing eight percentage points faster (+24.7% vs +16.9%) over the period between 2019 and 2022.
The Retail Trade workforce is younger than other sectors. Over one out of every five Retail workers was 21 years or younger in 2023, more than double the share of all industries (see Table 2). And while the share of workers under 22 expanded equally fast in Retail and all other sectors over the past decade, it grew nine times faster over the pandemic period as young workers jumped at Retail opportunities with rising wages.
Similarly, the share of Black, Indigenous or people of color (BIPOC) workers in Retail expanded 60% over 10 years and 22% over four years. In comparison, the white employment share declined 3% and 1% over those periods respectively. Lastly, the Retail sector has a slightly smaller share of women workers (48.2%) than the total of all industries (50.6%). A decade earlier, the Retail sector had a slightly higher share of female employment than all industries (51.6% to 51.4%), meaning the decline in share of women since 2013 was more rapid in the Retail sector.
| Table 2. Select Workforce Characteristics by Sector in Northeast Minnesota, 2013-2023 | ||||||
|---|---|---|---|---|---|---|
| Industry | 21 and Under Employment | BIPOC Employment | ||||
| 2023 Share | Percent Change in Share 2013-2023 | Percent Change in Share 2019-2023 | 2023 Share | Percent Change in Share 2013-2023 | Percent Change in Share 2019-2023 | |
| Retail Trade | 20.4% | +14.3% | +12.5% | 9.2% | +60.3% | +22.1% |
| Total, All Industries | 9.4% | +14.0% | +1.3% | 10.0% | +47.8% | +10.1% |
| Note: 2023 figures consist of Q2 2022-Q1 2023 Avg.
Source: U.S. Census Quarterly Workforce Indicators |
||||||
Contact Carson Gorecki, Labor Market Analyst, at carson.gorecki@state.mn.us.
