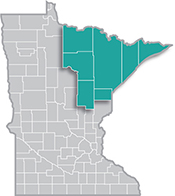
 Home to the state's second-largest metro, the Northeast Region has a strong industrial sector, tied largely to the area's abundant natural resources.
Most of the manufacturing base centers on mining and forest products industries. More than half of the sector's employment is in paper and machinery manufacturing.
Want the freshest data delivered by email? Subscribe to our regional newsletters.
1/26/2024 9:00:00 AM
Carson Gorecki
Behind the headline numbers detailing the number of jobs lost or gained is a more nuanced story. Under the surface of net employment change, which simply measures the total count of jobs from one period to another, there are many more jobs that are lost and gained. Businesses open and close and expand and contract each year, quarter, and month. These changes are also important, telling us more about the dynamics of the economy and workforce.
Fortunately, there are data available that tell the story of the "churn" underneath the surface numbers of net employment change. Business Employment Dynamics (BED) is a subset of information within DEED's Quarterly Census of Employment and Wages (QCEW). While comparing quarters and years of employment and establishment numbers in QCEW (Quarterly and annual averages of employment levels on the 12th day of each month.) will get you the net change, BED provides gross measures of job losses and gains. In addition, these job losses and gains are attributed to how business establishments themselves are changing, be that expanding, opening, contracting or closing. To indulge in a metaphor, if employment change data are a duck, the relative calm above water is QCEW and the legs churning below the water is BED.
To demonstrate the power of BED by example, here are some of the latest data for our region, Northeast Minnesota. Figure 1 shows the components of net employment change from 2021 to 2022; which includes job gains from businesses growing or opening; and job losses from businesses shrinking or shutting their doors. While the net employment change was a gain of about 450 jobs, more than 10,000 jobs were added or lost during the time frame.

The first thing that might jump out when looking at BED data is the sheer number of job changes (The BED statistics measure job changes at the establishment level and capture establishment job flows. They are not measures of movements of workers, or worker flows, that are brought about by hires and separations. The U.S. Census Bureau's Job-to-Job Flows Explorer and Quarterly Workforce Indicators do capture hires and separations.) that are occurring, compared to the net change. In 2020, a time of great tumult throughout the labor market, QCEW shows a net loss of 11,320 jobs from Q4 2019 (see Table 1). On its own this is a large relative change in employment. BED numbers show a larger net loss of 13,414 jobs due to a December-to-December comparison, instead of the quarterly averages that are the basis in QCEW. Yet it is the total gross job gains and losses that show just how dynamic the labor market is.

Let's look at a pre-pandemic year to demonstrate. The BED net employment change from 2017-2018 was +347 jobs. That was the result of 10,529 job gains and 10,182 job losses, or about 60 times as many labor transactions than the net number indicates. The overall churn, or absolute number of gross gains and losses was relatively consistent heading into the pandemic, sitting near 20,000. In 2020 there was a spike as gross job losses doubled, and gross job gains fell by 1,664 or about 17%.
In 2021, the script again flipped as gross job losses reverted to pre-pandemic levels and job gains jumped up to nearly 17,000 as the recovery kicked into gear. And then into 2022 we saw the second highest levels of gross job gains and gross job losses of the past six years, as we saw increased job mobility in a tightening labor market. Compared to previous years, job losses were more likely to be from businesses closing (30%) and job gains were more likely to be attributable to businesses expanding (84%).
A simple look at employment change may tell you an important story, but also leaves out a lot of interesting detail. Business Employment Dynamics can fill in the underlying details and provide a richer picture of how our labor market is performing. To belabor the water metaphor, QCEW is only the tip of the employment change iceberg.
If this article "whetted" your appetite and you would like to dive into more Business Employment Dynamics, check out the work by our researcher and resident BED expert Mustapha Hammida on the early impacts of the COVID-19 pandemic on Minnesota businesses by firm size.
Contact Carson Gorecki, Labor Market Analyst, at carson.gorecki@state.mn.us.
