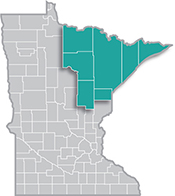
 Home to the state's second-largest metro, the Northeast Region has a strong industrial sector, tied largely to the area's abundant natural resources.
Most of the manufacturing base centers on mining and forest products industries. More than half of the sector's employment is in paper and machinery manufacturing.
Want the freshest data delivered by email? Subscribe to our regional newsletters.
2/22/2024 9:00:00 AM
Carson Gorecki
In recognition of February as Black History Month, this edition of my Local Look blog will focus on the Black or African American (we will use the term Black throughout the rest of this blog) workforce in Northeast Minnesota. The total Black population in Northeast Minnesota was estimated by the U.S. Census Bureau to be just under 4,400 people as of 2022. That means Black is the fifth largest racial or ethnic group in the seven-county region, behind White, American Indian & Alaska Native, Two or More Races, and Hispanic or Latino origin. The Black population grew by 21.5% since 2011, much faster than the 0.1% the total population grew over that same period. Black residents in Northeast Minnesota make up a relatively small but rapidly growing share of the total population (see Table 1).
| Table 1. Population by Race and Origin, 2022 | Northeast Minnesota | Minnesota | ||||
|---|---|---|---|---|---|---|
| Number | Percent |
Change from 2011-2022 Numeric | Percent |
Percent |
Change from 2011-2022 |
||
| Total | 325,995 | 100.0% | +292 | +0.1% | 100.0% | +7.9% |
| White | 295,732 | 90.7% | -7,582 | -2.5% | 79.7% | -0.4% |
| Black or African American | 4,382 | 1.3% | +774 | +21.5% | 6.7% | +44.3% |
| American Indian & Alaska Native | 7,273 | 2.2% | -1,793 | -19.8% | 0.9% | -10.2% |
| Asian & Other Pac. Islander | 2,459 | 0.8% | -18 | -0.7% | 5.1% | +37.1% |
| Some Other Race | 1,761 | 0.5% | +704 | +66.6% | 2.3% | +84.7% |
| Two or More Races | 14,388 | 4.4% | +8,207 | +132.8% | 5.3% | +159.6% |
| Hispanic or Latino origin | 5,936 | 1.8% | +2,030 | +52.0% | 5.7% | +34.6% |
| Source: U.S. Census Bureau, 2018-2022 American Community Survey | ||||||
As a share of the labor force – that is people currently employed or looking for work – Black Americans accounted for a slightly smaller 0.9%, when compared to their share of the total population. That relatively smaller share is partially due to a labor force participation rate of 44.5%, which was about 15 percentage points below the regional participation rate and the lowest among all racial and ethnic groups. Additionally, the unemployment rate for Black workers in the region was nearly five times higher than the unemployment rate for all workers.
As of 2023, Black workers held 2.3% of jobs in the region. Just as the Black population in Northeast Minnesota has grown in recent decades, so has the number of jobs held by Black workers. In fact, since 2003, Black employment in the region expanded 234% to 2,759 jobs in 2023 (see Figure 2). By comparison, overall employment grew 10.1% over the same period. The trend of strong Black employment growth continued recently as well as the number of jobs held by Black workers nearly doubled over the last decade, and grew 4.4% since 2019, when overall employment fell -6.1%. Over the past decade, Black workers were the fastest growing racial or ethnic group in the region.

Black workers in Northeast Minnesota were more likely to be employed in service-providing industries such as Health Care, Transportation, and Accommodation & Food Services rather than goods-producing industries like Mining, Manufacturing, and Construction. Three out of five jobs held by Black workers were in just three sectors: Health Care & Social Assistance, Transportation & Warehousing, and Accommodation & Food Services. By comparison, those sectors accounted for less than 40% of total employment (see Table 2).
Relative to total employment, Black workers were most concentrated in the Transportation & Warehousing and Administrative Support & Waste Management sectors. Transportation & Warehousing which accounted for a fifth of jobs held by Black workers, has more than doubled over the last decade. Relative to total employment, Black workers were least concentrated in Mining, Public Administration, Educational Services, and Construction, where the Black share of employment was less than half that of the total share.
| Table 2. Employment Distribution by Race and Sector in Northeast Minnesota, 2023 | ||
|---|---|---|
| Sector | Share of Black Employment | Share of Total Employment |
| Health Care & Social Assistance | 25.7% | 23.7% |
| Transportation & Warehousing | 20.2% | 6.0% |
| Accommodation & Food Services | 14.7% | 9.6% |
| Retail Trade | 7.7% | 11.0% |
| Administrative Support & Waste Management Services | 5.7% | 2.5% |
| Educational Services | 3.7% | 8.8% |
| Manufacturing | 3.2% | 5.6% |
| Professional, Scientific, & Technical Services | 3.1% | 4.1% |
| Other Services | 2.9% | 3.5% |
| Arts, Entertainment, & Recreation | 2.6% | 2.5% |
| Construction | 2.5% | 5.7% |
| Public Administration | 1.5% | 6.5% |
| Wholesale Trade | 1.4% | 2.3% |
| Information | 1.4% | 0.9% |
| Finance & Insurance | 1.3% | 2.5% |
| Mining, Quarrying, & Oil & Gas Extraction | 0.6% | 2.7% |
| Real Estate & Rental & Leasing | n/a | 1.0% |
| Management of Companies & Enterprises | n/a | 0.5% |
| Utilities | n/a | 1.2% |
| Source: U.S. Census Quarterly Workforce Indicators | ||
Finally, Black workers have benefited from increasing wages over the past four years. Overall, average monthly earnings rose about 18% in Northeast Minnesota from the year ending in Q1 2020 to the year ending Q1 2023 (U.S. Census Bureau's Quarterly Workforce Indicators). Black earnings rose 26.8%, the most among all racial and ethnic groups over that period. The next largest increase was 20.6% for Asian workers. Despite this growth in earnings, Black earnings were equivalent to only 63% of White earnings at the end of 2022. So, while disparities certainly remain and Black labor force participation, unemployment, and earnings continue to lag, more recent data in employment and earnings have indicated some positive changes for Black workers in Northeast Minnesota, an important and growing force in our economy.
Contact Carson Gorecki, Labor Market Analyst, at carson.gorecki@state.mn.us.
