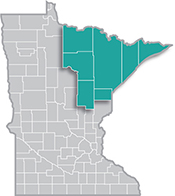
 Home to the state's second-largest metro, the Northeast Region has a strong industrial sector, tied largely to the area's abundant natural resources.
Most of the manufacturing base centers on mining and forest products industries. More than half of the sector's employment is in paper and machinery manufacturing.
Want the freshest data delivered by email? Subscribe to our regional newsletters.
4/23/2024 1:23:13 PM
Carson Gorecki
For something that accounts for nearly a third of workers' total compensation, we sure do not seem to talk about benefits much.
The discussion and response to the current tight labor market revolves mostly around wages, how much to raise them and what is the right level to be competitive in attracting and retaining workers. Wages are an undeniably important aspect of a job's compensation and for that reason deserve focus. However, another important component of compensation – employer-provided benefits – receives less attention. Benefits can range from the more common (health insurance, retirement savings, paid vacation, remote work and scheduling flexibility) to the more creative (free food, student loan repayment, use of the company car, gym memberships, etc.).
The role of benefits in overall compensation deserves a deeper look, especially as employers are exploring every way possible to be more attractive to jobseekers. Given two employers with equal wages, a next possible point of comparison becomes the respective benefits packages. What does the typical benefits package look like and how does it differ by occupation, industry, and private vs. public sector?
The most recent release from the Bureau of Labor Statistics' (BLS) Employer Costs for Employee Compensation Survey can answer some of these questions. It shows that for civilian workers, benefits accounted for 31.1% of total compensation nationally (see Table 1). That share was slightly lower for workers in the private sector (29.6%) and higher for state and local government workers (37.5%). The value of benefits for government workers was also higher, nearly twice the cost of benefits paid to private sector workers. Much of this difference is attributable to government jobs generally paying higher wages than the private sector, raising the cost of benefits commensurably. There is also a higher share of union representation among public sector workers which tend to have higher benefit compensation costs. Across the private sector, workers in unions had an average of 39.4% of compensation in benefits compared to 28.4% for non-union workers.

Within benefits, there are several categories. For all civilian workers, the largest benefit group by cost was insurance (26% of total benefits cost), followed by paid leave (24%), and legally required benefits (23%). The latter includes Social Security, Medicare, workers compensation, and Unemployment Insurance. The benefits categories with the largest differences between private and state and local government workers are supplemental pay and retirement and savings.
Private employers contribute relatively more to supplemental pay as government entities are often more constrained on what they can fund for overtime and bonuses. The cost of nonproduction bonuses in the private sector ($1.20 per hour worked) was more than four times greater than what was paid to government workers. As a result, 13% of private benefits costs were for supplemental pay compared to only 3% for the public sector. Conversely, government retirement and savings represented 35% of benefits costs compared to 12% for private employees. Over 90% of this cost for government workers is for defined benefit plans such as pensions. Defined benefit plans alone account for over 12% of total compensation for state and local government workers.
Among all civilian occupational groups (private sector and state and local government workers), primary, secondary, and special education schoolteachers had the highest relative share of total compensation committed to benefits with 34.2% (see Figure 1). Registered Nurses and workers in Production occupations also had more than a third of their compensation in benefits. At the other end of the spectrum, Sales and Related and Service occupations allocated 23.7% and 27.4% to benefits respectively. It is worth pointing out that Sales and Service occupations have higher shares of part-time workers and lower overall compensation.

Northeast Minnesota has a higher-than-average concentration of jobs in some of the industries and occupations with above-average benefits compensation. The Utilities (2.2), Public Administration (1.7), Health Care & Social Assistance (1.4), and Education Services (1.1) sectors all have location quotients greater than one, indicating there are relatively more of those types of jobs in our region than the statewide average. The sector with the highest relative employment concentration in the region, Mining, also has a significant union presence, typically a sign of higher benefits costs. Registered Nurses are 1.5 times more concentrated than average and teaching occupations are slightly more concentrated in Northeast Minnesota as well. Retail Trade and Leisure & Hospitality, which have the two lowest benefits shares of total compensation, are also more concentrated in the region.
Since benefits vary by employer, there is not currently a single great data source that allows us to assess the provision of benefits locally. Additionally, it can be difficult to put value on certain benefits, so comparing apples to apples across benefits plans is less straightforward than it is for wages. These facts, however, do not diminish the rising importance and relevance of benefits in a tight and competitive labor market. Employers and jobseekers will do well to know what typical benefits packages look like and how local competitors compare.
Contact Carson Gorecki, Labor Market Analyst, at carson.gorecki@state.mn.us.
