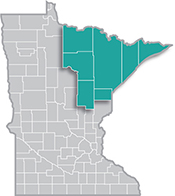
 Home to the state's second-largest metro, the Northeast Region has a strong industrial sector, tied largely to the area's abundant natural resources.
Most of the manufacturing base centers on mining and forest products industries. More than half of the sector's employment is in paper and machinery manufacturing.
Want the freshest data delivered by email? Subscribe to our regional newsletters.
5/28/2024 1:23:13 PM
Carson Gorecki
Occupational Employment & Wage Statistics, or OEWS, provides detailed information for over 800 individual occupations across more than 30 geographies in Minnesota. These data are derived by surveying tens of thousands of Minnesota businesses, and is updated annually. The most recent vintage, 2024, is hot off the presses and full of useful, richly detailed information on all types of jobs. Here are some initial highlights for Northeast Minnesota.
OEWS showed an estimate of just over 138,000 jobs in Northeast Minnesota as of the first quarter of 2024. The occupational groups with the most jobs were Office & Administrative Support (16,760 jobs), Food Preparation & Serving Related (13,910), Sales & Related (11,740), Healthcare Practitioners & Technical (11,510), and Healthcare Support (9,260). These five occupational groups accounted for nearly half (46%) of employment in the region.
Some jobs are more concentrated or more common in Northeast Minnesota when compared to statewide employment. Location quotients are a measure of this relative concentration. A location quotient above one means higher than average concentration.
Despite being only the 14th-largest occupational group in the region, Community & Social Service was the most concentrated relative to the state. With a location quotient of 1.54, the Community & Social Service employment share of the region's total employment was 1.54 times the occupational group's statewide employment share. Similarly, Construction & Extraction (1.43) and Protective Service (1.40) occupations were also more common in Northeast Minnesota than the rest of the state. Healthcare Practitioners & Technical (1.3) and Healthcare Support (1.14) occupations both had above average concentrations as did the heart of Leisure & Hospitality jobs via Food Preparation and Serving Related (1.25) occupations. The occupational groups that were least concentrated in Northeast include Computer & Mathematical (0.44), Legal (0.59), and Business & Financial Operations (0.61) occupations.
The most concentrated detailed occupations with at least 50 jobs reflected the region's specialization in extractive industries like Mining & Logging (see Table 1). Mining & Geological Engineers, including Mining Safety Engineers (13.05) were most concentrated followed by Foresters (9.28), Logging Equipment Operators (8.70), and Forest and Conservation Technicians (8.56). The least concentrated occupations were Packaging and Filling Machine Operators and Tenders (0.20), Printing Press Operators (0.21), Food Batchmakers (0.24), and Marketing Managers (0.24).
| Table 1. The Most and Least Concentrated Occupations in Northeast Minnesota, 2024 | |||
|---|---|---|---|
| Occupation Title | Employment | Median Annual Wage | Location Quotient |
| Mining & Geological Engineers, Including Mining Safety Engineers | 50 | $102,037 | 13.05 |
| Foresters | 160 | $71,356 | 9.28 |
| Logging Equipment Operators | 100 | $47,237 | 8.70 |
| Forest & Conservation Technicians | 250 | $53,442 | 8.56 |
| Electrical & Electronics Repairers, Commercial & Industrial Equipment | 210 | $83,927 | 7.43 |
| Gambling Surveillance Officers & Gambling Investigators | 60 | $37,668 | 5.96 |
| Crushing, Grinding, & Polishing Machine Setters, Operators, & Tenders | 210 | $70,475 | 5.55 |
| Paper Goods Machine Setters, Operators, & Tenders | 580 | $69,218 | 5.31 |
| Power Plant Operators | 160 | $85,846 | 5.30 |
| Switchboard Operators, Including Answering Service | 50 | $38,607 | 4.54 |
| Total, All Occupations | 138,010 | $48,694 | 1.00 |
| Office & Administrative Support Workers, All Other | 110 | $37,162 | 0.36 |
| Bill & Account Collectors | 70 | $51,648 | 0.36 |
| Computer & Information Systems Managers | 170 | $128,898 | 0.34 |
| Software Developers | 590 | $109,530 | 0.32 |
| Management Analysts | 310 | $81,349 | 0.31 |
| Medical Scientists, Except Epidemiologists | 80 | $105,125 | 0.30 |
| Marketing Managers | 100 | $132,023 | 0.24 |
| Food Batchmakers | 70 | $37,180 | 0.24 |
| Printing Press Operators | 60 | $41,663 | 0.21 |
| Packaging & Filling Machine Operators & Tenders | 70 | $45,343 | 0.20 |
| Source: DEED Occupational Employment & Wage Statistics | |||
Requests for the detailed wage data available in OEWS are among the most common I receive as a regional analyst. At the most general level, the median wage for all occupations in the region was $23.41 an hour, equivalent to a full-time annual median wage of $48,694 (see Table 2). The 25th percentile annual wage was $36,093 and the 75th percentile wage was $72,867, meaning that half of all jobs in the region paid between those two figures.
Per the newest data, there were 42 occupations in the region that paid an annual median wage at or above $100,000. Combined, those jobs represented just under 5% of total employment in the region. The highest paying occupational groups were Management ($94,198 annual median wage), Computer & Mathematical ($88,126), Legal ($84,295), Architecture & Engineering ($83,439), and Healthcare Practitioners & Technical ($81,169). Occupations in those groups accounted for 17.4% of regional jobs, but only Healthcare Practitioners & Technical occupations had higher than average employment concentration when compared to the state. The highest paying individual occupations included many types of Dentists and Doctors, Electronics Engineers, Judges, Architectural & Engineering Managers, Pharmacists, Chief Executives, Psychologists, and Nurse Practitioners; all earning annual median wages north of $132,000.
| Table 2. Wage Statistics by Occupational Group for Northeast Minnesota, Q1 2024 | ||
| Occupational Group | Hourly Median Wage | Annual Median Wage |
| Management | $45.28 | $94,198 |
| Computer and Mathematical | $42.37 | $88,126 |
| Legal | $40.53 | $84,295 |
| Architecture and Engineering | $40.12 | $83,439 |
| Healthcare Practitioners and Technical | $39.02 | $81,169 |
| Life, Physical, and Social Science | $35.31 | $73,439 |
| Business and Financial Operations | $34.89 | $72,562 |
| Construction and Extraction | $32.73 | $68,088 |
| Installation, Maintenance, and Repair | $29.94 | $62,283 |
| Protective Service | $26.04 | $54,161 |
| Educational Instruction and Library | $25.65 | $53,358 |
| Community and Social Service | $25.46 | $52,941 |
| Production | $24.87 | $51,723 |
| Total, All Occupations | $23.41 | $48,694 |
| Arts, Design, Entertainment, Sports, and Media | $23.33 | $48,539 |
| Farming, Fishing, and Forestry | $22.88 | $47,596 |
| Office and Administrative Support | $22.44 | $46,662 |
| Transportation and Material Moving | $21.66 | $45,038 |
| Healthcare Support | $17.99 | $37,424 |
| Building and Grounds Cleaning and Maintenance | $17.48 | $36,372 |
| Personal Care and Service | $17.17 | $35,725 |
| Sales and Related | $16.96 | $35,269 |
| Food Preparation and Serving Related | $14.40 | $29,953 |
| Source: DEED Occupational Employment and Wage Statistics | ||
If these data only served to whet your stats appetite, check out more great occupational data via our OEWS tool or one of the many others that utilizes OEWS data such as Occupations in Demand, Career Pathways, or Employment Outlook. Each page includes tutorials and information on how to use the tool and interpret the data. Your regional analyst is also always willing to help!
Contact Carson Gorecki, Labor Market Analyst, at carson.gorecki@state.mn.us.
