 The presence of such industry powerhouses as Polaris, Arctic Cat and New Flyer make Northwest Minnesota a hub of transportation equipment manufacturing.
From wheat and potatoes to soybeans and sugar beets, the region is a major producer and processor of food staples and specialty agricultural products.
Want the freshest data delivered by email? Subscribe to our regional newsletters.
8/21/2017 12:04:56 PM
Chet Bodin
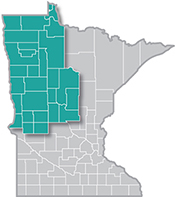
After adding new data on population, labor force, and industry employment changes, DEED's Regional Analysis and Outreach Unit released updated 2017 Regional Profiles in August. These annual publications outline a variety of demographic, labor market, and economic information and analysis for each planning region and economic development region (EDR) of the state. The 2017 Regional Profile for Northwest Minnesota outlines several significant changes the region's economy experienced over the past year. Here are a few changes that stood out, including major demographic changes, labor market shifts and employment trends.
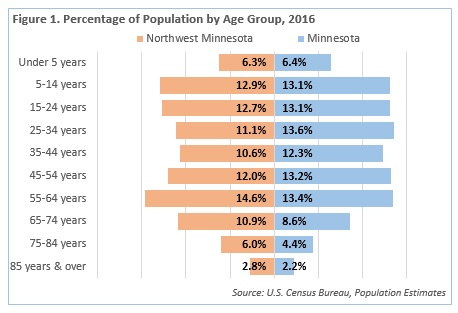
Although the aging of the baby boomer generation has had statewide effects on the labor market, those changes are being felt most in rural parts of the state such as the Northwest, where the makeup of the population is weighted more heavily in older age groups. In Northwest Minnesota, over one-third of the population (34.3%) is over 55 years of age, compared to 28.6 percent statewide (Figure 1). Not only is the proportion of older residents higher in Northwest Minnesota – it is increasing at a rapid rate. As a result, retirements appear to be on the rise in Northwest Minnesota, leading employers to spend more time and energy on succession planning and employment challenges.

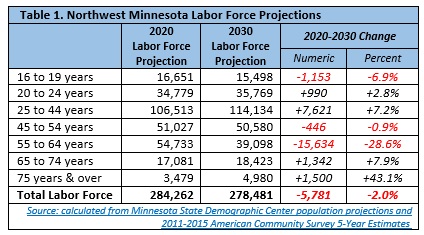
Although the exit of baby boomers from the labor market will continue to challenge regional planners and employers, Northwest Minnesota is still expected to add 8,500 workers 20 to 44 years of age. Ideally, these labor market entrants will be able to fill several replacement openings that regional employers choose to fill. Applying current labor force participation rates to future population projections from the Minnesota State Demographic Center shows how the region's workforce might change in the next decade (Table 1).

Despite the new entrants in the younger age groups, the regional labor force is still projected to contract by 2.0 percent, or over 5,700 workers. As a result, employers must continue to decide whether to increase regional recruitment efforts, or adjust to the new normal. Within the region, it appears that EDR 1 - Northwest will suffer the biggest loss in labor force supply, where it is projected to shrink by 4.8 percent from 2020 to 2030. EDR 5 - North Central is expected to lose over 2,000 workers, a 2.6 percent decline, and EDR 4 - West Central may lose 1,336 workers, a 1.1 percent drop. EDR 2 - Headwaters, on the other hand, is projected to remain relatively steady, decreasing by only 0.1 percent through 2030. Although this will make hiring easier in EDR 2 than in other parts of Northwest Minnesota, the labor market loss is still a significant change from the steady growth the region has enjoyed over the past couple decades.
Even with the tight labor market conditions, Northwest Minnesota's economy continued growing in 2016. For the second straight year, the region added jobs at a 0.6 percent clip, a gain of just under 1,300 jobs in the past year. Interestingly, three of the four economic development regions added more jobs in 2016 than the year before, but in EDR 1 – Northwest, employment shrunk by 1.5 percent (Table 2).

It's less clear whether the employment loss in EDR 1 was intentional, or simply the result of changes in the regional labor supply. Job vacancies in EDR 1 were down by 39 percent in the second quarter of 2016 compared to the year before, and the labor force shrunk by more than 200 workers. This seems to indicate that as workers left the labor market in EDR 1, local employers did not attempt to replace them as often as in other regions – at least during the first half of 2016. In the second half of the year, regional job vacancies soared to the highest number ever for EDR 1. Despite the hiring push, EDR 1 sustained a net employment loss. The upcoming second quarter of 2017 Job Vacancy Survey, which will be released this fall, should indicate whether employers in EDR 1 are going to continue soliciting workers at a high rate, or slow hiring in an attempt to regroup and adjust to labor force changes.
In contrast, job growth in EDR 2- Headwaters increased strongly in 2016, and it became the only EDR in the Northwest planning area to exceed the statewide growth rate. As with EDR 1, regional demographics may be influencing this shift as well. In addition to a higher than average proportion of residents over 55 years of age, EDR 2 also has a higher proportion of people aged 15 to 24 who are just entering the labor market. Because of this, regional employers may be able to replace older workers who exit the labor force with new workers much more easily.
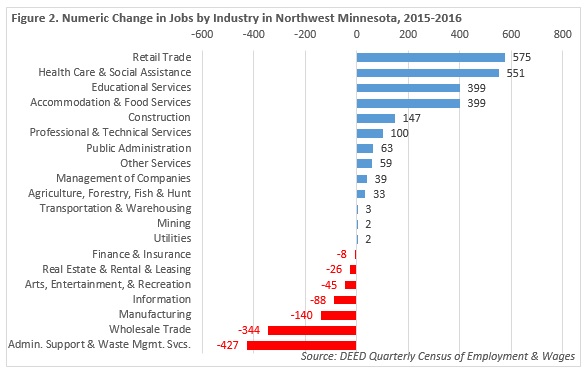
Employment changes in 2016 also varied by industry in Northwest Minnesota. After a period of job decline, health care and social assistance bounced back in 2016, adding over 550 net new jobs – a 1.5 percent increase. In addition, retail trade, educational services, accommodation and food services, and construction each added over 100 jobs since 2015. Industries that lost the most jobs included information (-88 jobs), manufacturing (-140 jobs), wholesale trade (-344 jobs), and administrative support and waste management services (-427 jobs), which most notably includes temporary staffing agencies (Figure 2).

The 2017 Regional Profile for Northwest Minnesota is available on the Northwest Regional Labor Market webpage, along with profiles for each Economic Development Region in the planning area. County profiles are also available upon request by contacting Chet Bodin.