 The presence of such industry powerhouses as Polaris, Arctic Cat and New Flyer make Northwest Minnesota a hub of transportation equipment manufacturing.
From wheat and potatoes to soybeans and sugar beets, the region is a major producer and processor of food staples and specialty agricultural products.
Want the freshest data delivered by email? Subscribe to our regional newsletters.
12/7/2018 3:00:00 PM
Cameron Macht
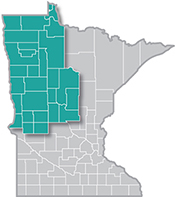
As reported in previous blog posts, Northwest Minnesota has become more racially diverse over time, leading to a growing population and labor force. While the region is still relatively non-diverse, the number of jobs held by workers of races other than white was growing rapidly. According to data from the Quarterly Workforce Indicators program, about 92.8 percent of jobs in the 26-county Northwest planning region were held by workers who identified as white alone.
Despite comprising just 7 percent of all jobholders, workers of other races accounted for 39 percent of the new jobs added in the region from 2012 to 2017. The number of jobs held by black or African American workers climbed 86.5 percent from 2012 to 2017, more than 30 percent for workers of two or more races, nearly 25 percent for Asian workers, and 7 percent for American Indians and Alaska Natives, compared to a 2.5 percent increase for whites (Figure 1). Per QWI program data, there were 147 Native Hawaiian or Other Pacific Islanders working in Northwest Minnesota – less than 0.1% of the total workforce.

Almost every industry benefited from hiring workers of other races over the past five years, with Mining and Arts, Entertainment, and Recreation being the only exceptions. Interestingly enough, those two industries represent the least and most racially diverse industries in the region – the Mining workforce is 100 percent white, while nearly one-third of the Arts, Entertainment, and Recreation workforce was some other race, including 27 percent who were American Indian or Alaska Natives.
Likewise, many American Indians worked in Public Administration, accounting for just over 13 percent of total jobs in the industry in Northwest Minnesota. Accommodation and Food Services was staffed by several different race groups, including American Indians, Black or African Americans, Asian or Other Pacific Islanders, and people of Two or More Races. Health Care and Social Assistance positions were also held by a broader range of workers across different race groups.
In contrast, more than 98 percent of workers in Information, Utilities, Management of Companies, and Mining were white alone in 2017, showing a significant lack of diversity despite the changes occurring in the region’s workforce (Figure 2). To that end, the largest increases in racial diversity were shown in the Public Administration, Accommodation and Food Services, Real Estate and Leasing, and Agriculture, Forestry, Fishing and Hunting industries.

Contact Cameron Macht at 320-441-6596.
