 The presence of such industry powerhouses as Polaris, Arctic Cat and New Flyer make Northwest Minnesota a hub of transportation equipment manufacturing.
From wheat and potatoes to soybeans and sugar beets, the region is a major producer and processor of food staples and specialty agricultural products.
Want the freshest data delivered by email? Subscribe to our regional newsletters.
10/16/2019 4:00:00 PM
Cameron Macht
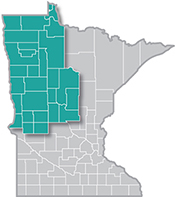
Armed with new population estimates, labor force trends, commuting patterns, occupations in demand, and industry employment statistics, DEED’s Regional Analysis & Outreach Unit recently published a fresh regional profile highlighting trends in Northwest Minnesota.
Along with population and labor force growth, Northwest Minnesota has been fortunate to experience employment growth over the past 15 years. According to DEED’s Quarterly Census of Employment & Wages (QCEW) program, Northwest was home to 17,096 business establishments providing 222,596 covered jobs in 2018, with a total payroll that surpassed $9.0 billion. That was about 7.7 percent of total employment in the state of Minnesota.
Northwest Minnesota gained just over 15,000 net new jobs from 2003 to 2018. The region grew more slowly than the state prior to the recession but experienced smaller declines during the recession, resulting in a shorter road to recovery. Like the state, the region fully recovered all the jobs lost during the recession by 2013. Then between 2013 and 2018, the region added almost 9,000 jobs, enjoying a 4.1 percent gain, compared to 7.0 percent growth statewide (Figure 1).

According to DEED’s Quarterly Employment Demographics (QED) program, while the workforce was growing over the past 10 years, it was also aging. Over one-quarter (25.1%) of workers in the region were 55 years or older, compared to 21.5 percent statewide and just 18.7 percent in the region one decade earlier. In contrast, the percentage of teenaged workers was falling, and while wages were going up for younger workers, the number of hours worked was going down (Table 1).

Wages were climbing across the board for all workers due to rising demand and a tight labor market. While wages were still lowest for the youngest and oldest workers who tend to fill lower-skilled, less than full-time jobs in industries like retail trade and accommodation and food services, these two age groups enjoyed the fastest percentage increase in wages from 2008 to 2018. Wages were highest for workers between 45 and 64 years of age, and males worked more hours than females, though the gap was narrowing.
Contact Cameron Macht at 320-441-6596.
