 The presence of such industry powerhouses as Polaris, Arctic Cat and New Flyer make Northwest Minnesota a hub of transportation equipment manufacturing.
From wheat and potatoes to soybeans and sugar beets, the region is a major producer and processor of food staples and specialty agricultural products.
Want the freshest data delivered by email? Subscribe to our regional newsletters.
10/7/2020 9:00:00 AM
Erik White
Manufacturing is the second-largest employing industry in Northwest Minnesota, behind only Health Care and Social Assistance, with nearly 30,000 employees at 827 firms. Not only is the industry growing, but the average annual wages in 2019 exceeded the regional average by more than $11,000 (Table 1).
The largest sectors include Food, Transportation Equipment, Fabricated Metal Products, Machinery, and Wood Products Manufacturing, with over 3,000 jobs each. Subsectors that experienced the most growth in the past five years include Beverage and Tobacco Product Manufacturing (212.2%), Chemical Manufacturing (59.7%) and Miscellaneous Manufacturing (42.6%) (Table 1).
| Table 1. Northwest Minnesota Manufacturing Statistics | |||||||||
|---|---|---|---|---|---|---|---|---|---|
| 2019 Annual Data | 2018-2019 Change | 2014-2019 Change | |||||||
| NAICS Code | Industry Title | Number of Firms | Number of Jobs | Total Wages | Average Annual Wage | Number | Percent | Number | Percent |
| 0 | Total, All Industries | 17,126 | 223,205 | $9,312,717,743 | $41,704 | +512 | +0.2% | +6,811 | +3.1% |
| 31 | Manufacturing | 827 | 29,473 | $1,553,201,915 | $52,728 | +303 | +1.0% | +933 | +3.3% |
| 311 | Food Manufacturing | 89 | 5,917 | $311,074,297 | $52,520 | -25 | -0.4% | +195 | +3.4% |
| 336 | Transportation Equip. Manufacturing | 34 | 4,337 | $241,934,078 | $55,848 | +251 | +6.1% | -516 | -10.6% |
| 332 | Fabricated Metal Product Mfg. | 161 | 4,162 | $203,866,929 | $48,984 | +121 | +3.0% | +49 | +1.2% |
| 333 | Machinery Manufacturing | 97 | 3,984 | $242,160,116 | $60,788 | +103 | +2.7% | +636 | +19.0% |
| 321 | Wood Product Manufacturing | 73 | 3,407 | $183,799,920 | $53,976 | -115 | -3.3% | -106 | -3.0% |
| 323 | Printing & Related Support Activities | 52 | 1,262 | $58,541,856 | $46,696 | -46 | -3.5% | -128 | -9.2% |
| 327 | Nonmetallic Mineral Product Mfg. | 54 | 968 | $58,763,615 | $60,736 | -22 | -2.2% | +110 | +12.8% |
| 334 | Computer & Electronic Product Mfg. | 19 | 949 | $56,152,579 | $59,176 | +2 | +0.2% | +18 | +1.9% |
| 326 | Plastics & Rubber Products Mfg. | 29 | 922 | $39,775,485 | $43,108 | -5 | -0.5% | +54 | +6.2% |
| 339 | Miscellaneous Manufacturing | 87 | 834 | $33,870,612 | $40,560 | +17 | +2.1% | +249 | +42.6% |
| 331 | Primary Metal Manufacturing | 6 | 648 | $34,890,480 | $53,976 | -11 | -1.7% | -37 | -5.4% |
| 337 | Furniture & Related Product Mfg. | 60 | 643 | $28,308,651 | $44,044 | -6 | -0.9% | +43 | +7.2% |
| 325 | Chemical Manufacturing | 12 | 412 | $25,058,559 | $60,632 | +8 | +2.0% | +154 | +59.7% |
| 314 | Textile Product Mills | 18 | 392 | $11,617,476 | $29,640 | -18 | -4.4% | -63 | -13.8% |
| 312 | Beverage & Tobacco Product Mfg. | 20 | 256 | $5,987,592 | $23,244 | +33 | +14.8% | +174 | +212.2% |
| 335 | Electrical Equip., Appliance, & Comp. | 5 | 135 | $6,650,130 | $48,984 | +9 | +7.1% | N/A | N/A |
| Source: DEED's Quarterly Census of Employment and Wages (QCEW) | |||||||||
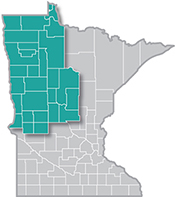
Within the Northwest planning region, Economic Development Region 1 (EDR 1) has the greatest reliance on Manufacturing jobs, with a location quotient of 1.77 – meaning Manufacturing employment is nearly twice as concentrated in the region as in the rest of the state. EDR 4 - West Central had 13,116 Manufacturing employees, the most of any EDR in Northwest Minnesota, and a location quotient of 1.29 also indicating more concentration than that at the state level.
In contrast, with around 2,500 jobs, EDR 2 - Headwaters had the smallest amount of employment in Manufacturing. However, the region has seen jobs in the industry increase by 116 jobs in the past five years, a 4.8% expansion. Interestingly, despite having the highest concentration, manufacturing jobs dropped 10% in EDR-1 Northwest over the past five years, while the other EDRs all saw gains (Table 2)
| Table 2. Northwest Minnesota Manufacturing Statistics | |||||||||
|---|---|---|---|---|---|---|---|---|---|
| 2019 Annual Data | Avg Annual Wage | 2018-2019 Change | 2014-2019 Change | Location Quotient | |||||
| Number of Firms | Number of Jobs | Total Wages | Number | Percent | Number | Percent | |||
| Northwest Minnesota | 827 | 29,473 | $1,553,201,915 | $52,728 | +303 | +1.0% | +933 | +3.3% | 1.18 |
| EDR 1 - Northwest | 120 | 7,209 | $406,486,392 | $56,472 | +149 | +2.1% | -821 | -10.2% | 1.77 |
| EDR 2 - Headwaters | 78 | 2,532 | $130,831,318 | $51,688 | -27 | -1.1% | +116 | +4.8% | 0.70 |
| EDR 4 - West Central | 341 | 13,116 | $701,627,160 | $53,508 | +171 | +1.3% | +1,063 | 8.8% | 1.29 |
| EDR 5 - North Central | 288 | 6,616 | $314,257,045 | $47,476 | +11 | +0.2% | +576 | +9.5% | 0.94 |
| Minnesota | 8,261 | 323,954 | $22,054,885,371 | $68,068 | +2,054 | +0.6% | +12,128 | +3.9% | 1.00 |
| Source: DEED's Quarterly Census of Employment and Wages (QCEW) | |||||||||
Given the high level of manufacturing employment in EDR 1, it's understandable that the industry and region was hit hard during the early months of the COVID-19 pandemic. Data from DEED's Unemployment Insurance Statistics shows that continued Unemployment Insurance (UI) claims rose steadily in March, and those from Manufacturing accounted for approximately one-third of all claims through May. Continued claims are the weekly request for benefits that unemployed workers make following their initial application. Across Minnesota, the share hovered around 10% from mid-February to the beginning of September, with one notable dip early on (Figure 1).

However, there are indications in the data from mid-July onward that manufacturing is rebounding, as the share of continued UI claims for the industry has dropped to pre-COVID levels. The share of claims refers to the percent of total continued UI claims attributed to Manufacturing in the region.
The turnaround indicates that a number of employers in Northwest Minnesota took measures to protect and maintain their workers. Marvin, a window and door manufacturer based in Warroad, recognized the need to keep as many workers as possible despite the challenges COVID-19 has presented to workplace health and safety.
Although they furloughed most of their workforce early on, Marvin worked to reassure employees the move was only temporary and sought to avoid any permanent layoffs. "Our leadership made communication with our workforce a top priority while we worked through how to operate during the pandemic," said Eric Rasmussen, senior manager for talent acquisition. "We always want to avoid layoffs, but also try to provide financial security for our employees during difficult times. Furloughed workers could access the expanded unemployment assistance, and still had access to our health care insurance."
It appears this approach paid off for many employers in the region. By mid-July, the share of continued unemployment claims from manufacturing dropped off significantly. When applicants stop requesting a weekly benefit payment, there's a good chance they returned to a job. Or, as in the case with Marvin and others, the employee returned to work after a temporary furlough.
In addition to utilizing Minnesota's UI program, regional employers deployed other layoff aversion strategies during the onset of COVID-19. Some cut hours across the board, or reduced retirement contributions for a period of time. Others used a combination of both tactics. Employees whose hours were cut in half or more were eligible for partial unemployment benefits, while their relationship with their employer remained intact.
Unfortunately, some layoffs were unavoidable. The good news is there are several manufacturers in Northwest Minnesota who are hiring again. DEED has made a concerted effort to share which occupations are still in demand, including several production-related occupations. Many of those who were laid off also qualify for Dislocated Worker assistance, or other training grant programs which can provide financial support to develop new job skills or cover transportation costs to a new employer. With the support of both public agencies and private industry, Minnesotans are getting back to work. And in Northwest Minnesota, Manufacturing is leading the way.

Contact Erik White.
