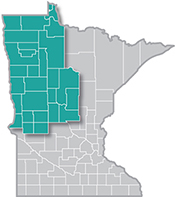
 The presence of such industry powerhouses as Polaris, Arctic Cat and New Flyer make Northwest Minnesota a hub of transportation equipment manufacturing.
From wheat and potatoes to soybeans and sugar beets, the region is a major producer and processor of food staples and specialty agricultural products.
Want the freshest data delivered by email? Subscribe to our regional newsletters.
3/11/2022 9:00:00 AM
Cameron Macht
Prior to the pandemic, there were more than 136,000 female workers in the labor force in Northwest Minnesota, accounting for over 47% of the total workforce in the region. Interestingly, the population of males and females aged 16 years and over was nearly identical, but the male labor force participation rate checked in at 67.6% compared to 60.7% for females, leading to about 15,000 more male workers than female.
The cause of the discrepancy between male and female labor force participation is likely due in large part to women taking on more child raising responsibilities, as demonstrated by rates for different age groups.
For example, teenage females were more likely to be participating in the labor force than males from 16 to 19 years of age, and the rates were just 0.8% different for 20 to 24 year olds. In these youngest age groups, both females and males account for about 22,000 workers in the region.
But for people in their prime working years from 25 to 54 – which are also the prime childbearing and rearing years – participation rates are about 7.0% lower for females than males. Rates stay lower for females from 55 to 74 years as well. And perhaps the biggest difference is in the oldest age group – with females outnumbering males by nearly 7,000 people, but with a labor force participation rate that was half as high as for males (see Table 1).
| Table 1. Northwest Minnesota Employment Characteristics | Minnesota | |||
|---|---|---|---|---|
| By Gender, 2019 | Total Population | In Labor Force | Labor Force Participation Rate | Labor Force Participation Rate |
| Male, 16 years & over | 224,072 | 151,579 | 67.6% | 73.5% |
| 16 to 19 years | 14,694 | 7,499 | 51.0% | 50.1% |
| 20 to 24 years | 17,506 | 14,592 | 83.4% | 84.0% |
| 25 to 44 years | 63,997 | 58,509 | 91.4% | 92.3% |
| 45 to 54 years | 33,386 | 29,929 | 89.6% | 90.5% |
| 55 to 64 years | 41,384 | 30,318 | 73.3% | 76.5% |
| 65 to 74 years | 31,281 | 8,864 | 28.3% | 31.8% |
| 75 years & over | 21,824 | 1,868 | 8.6% | 9.2% |
| Female, 16 years & over | 224,435 | 136,226 | 60.7% | 65.9% |
| 16 to 19 years | 13,486 | 7,737 | 57.4% | 56.4% |
| 20 to 24 years | 17,014 | 14,061 | 82.6% | 85.2% |
| 25 to 44 years | 60,608 | 51,265 | 84.6% | 85.1% |
| 45 to 54 years | 32,616 | 26,776 | 82.1% | 84.6% |
| 55 to 64 years | 41,244 | 27,689 | 67.1% | 69.7% |
| 65 to 74 years | 30,877 | 7,455 | 24.1% | 24.3% |
| 75 years & over | 28,590 | 1,243 | 4.3% | 4.7% |
| Source: 2015-2019 American Community Survey, 5-Year Estimates | ||||
Even though their labor force participation rates were lower than for males, the number of female workers had been increasing over time as the region's population continued to increase. While we do not have details at the regional level yet, U.S. and statewide data show that labor force participation rates for both males and females have fallen since the onset of the COVID-19 pandemic, but most notably for women. Nationally, the female labor force participation rate dropped from 57.9% in February of 2020 to a low of 54.6% in April of 2020, before climbing back to 56.6% in February of 2022 (see Figure 1). For males, it started at 69.3% but has bounced back to 68.3%, down just -1.0% from pre-pandemic levels.
Figure 1. U.S. Labor Force Participation Rate - Females, 2019-2022

At the state level, our alternative measures of unemployment show a 12-month rolling average of 63.6% female labor force participation in December of 2021, compared to 66.2% in February of 2020, prior to the impact of the pandemic. Rates also dropped for males in Minnesota, from 73.9% in February 2020 to 71.8% in December of 2021. In both cases, the decline was more severe for females than for males.
If female labor force participation rates declined the same amount in Northwest Minnesota as the state overall, that would equal the loss of 5,829 female workers in 2021 compared to 2019. That is a significant loss of workers for a region that was already struggling with a tight labor force against rising job vacancies.
The reasons for the workforce challenges are varied, but include difficulties with child care, elder care, and other family responsibilities; more layoffs and a slower initial recovery from pandemic-related losses in industries that have more female workers – such as Health Care & Social Assistance, Accommodation & Food Services, Other Services, Educational Services, and Arts, Entertainment & Recreation – and faster than expected retirements among the older population.
Contact Cameron Macht at 320-441-6596.
