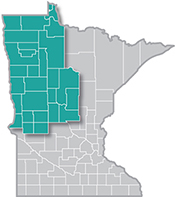
 The presence of such industry powerhouses as Polaris, Arctic Cat and New Flyer make Northwest Minnesota a hub of transportation equipment manufacturing.
From wheat and potatoes to soybeans and sugar beets, the region is a major producer and processor of food staples and specialty agricultural products.
Want the freshest data delivered by email? Subscribe to our regional newsletters.
7/7/2022 9:00:00 AM
Cameron Macht
In addition to surging levels of current demand, Minnesota's Northwest Region is also projected to see strong job growth over the next decade. This round of projections start with the recession-depressed job counts from 2020, and therefore some of the expected growth is actually remaining job recovery. However, even once the region gets back to pre-pandemic employment levels, we forecast additional growth.
This includes faster gains in the industries that were hardest hit, including Arts, Entertainment & Recreation, Accommodation & Food Services and Other Services, which typically are not among the fastest growing industries in our 10-year forecasts. To that end, Health Care & Social Assistance is again expected to be the largest growing and one of the fastest growing industries, potentially accounting for as much as one-third of total projected job gains through 2030.
Other industries that should see substantial growth in the region include Educational Services, Manufacturing, Wholesale Trade, Construction, Professional & Technical Services, and Public Administration. In contrast, only five of the 20 main industries are projected to lose jobs over the decade, with the biggest decline predicted in Retail Trade as consumer behaviors continue to change. Though relatively small, Utilities is expected to see the fastest decline, cutting nearly 15% of employment from 2020 to 2030 (see Table 1).
| Table 1. Northwest Minnesota Industry Employment Projections, 2020-2030 | |||||
|---|---|---|---|---|---|
| NAICS Code | Industry | Estimated Employment 2020 | Projected Employment 2030 | Percent Change 2020-2030 | Numeric Change 2020-2030 |
| 0 | Total, All Industries | 250,722 | 263,441 | +5.1% | +12,719 |
| 62 | Health Care & Social Assistance | 36,901 | 41,390 | +12.2% | +4,489 |
| 67 | Self-Employed & Unpaid Family Workers | 29,526 | 29,674 | +0.5% | +148 |
| 31 | Manufacturing | 27,999 | 28,618 | +2.2% | +619 |
| 44 | Retail Trade | 26,846 | 25,467 | -5.1% | -1,379 |
| 9 | Public Administration | 22,824 | 23,240 | +1.8% | +416 |
| 61 | Educational Services | 22,015 | 23,101 | +4.9% | +1,086 |
| 72 | Accommodation & Food Services | 17,040 | 20,515 | +20.4% | +3,475 |
| 42 | Wholesale Trade | 11,829 | 12,347 | +4.4% | +518 |
| 23 | Construction | 10,693 | 11,157 | +4.3% | +464 |
| 81 | Other Services | 9,052 | 10,144 | +12.1% | +1,092 |
| 48 | Transportation & Warehousing | 6,436 | 6,741 | +4.7% | +305 |
| 52 | Finance & Insurance | 6,053 | 6,227 | +2.9% | +174 |
| 11 | Agriculture, Forestry, Fishing & Hunting | 5,574 | 5,505 | -1.2% | -69 |
| 54 | Professional & Technical Services | 4,927 | 5,360 | +8.8% | +433 |
| 71 | Arts, Entertainment, & Recreation | 3,406 | 4,303 | +26.3% | +897 |
| 56 | Administrative Support & Waste Mgmt. Services | 3,889 | 4,139 | +6.4% | +250 |
| 51 | Information | 2,276 | 2,229 | -2.1% | -47 |
| 53 | Real Estate & Rental & Leasing | 1,425 | 1,414 | -0.8% | -11 |
| 22 | Utilities | 1,135 | 970 | -14.5% | -165 |
| 55 | Management of Companies | 660 | 665 | +0.8% | +5 |
| 21 | Mining | 216 | 235 | +8.8% | +19 |
| Source: DEED 2020 to 2030 Employment Outlook | |||||
In addition to new job growth, there is also projected to be substantial demand for workers to fill jobs left open from labor force exits. These are jobs that currently exist but will become available as current workers retire, leave the labor force for other reasons, or change careers completely. For every occupational group, there are significantly more labor market exits and replacement openings than new jobs created, so the region will need to tap into every worker group available (see Figure 1).

Contact Cameron Macht at 320-441-6596.
