 The presence of such industry powerhouses as Polaris, Arctic Cat and New Flyer make Northwest Minnesota a hub of transportation equipment manufacturing.
From wheat and potatoes to soybeans and sugar beets, the region is a major producer and processor of food staples and specialty agricultural products.
Want the freshest data delivered by email? Subscribe to our regional newsletters.
11/8/2022 9:00:00 AM
Anthony Schaffhauser
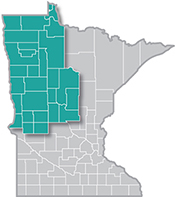
In addition to the extraordinary value of each veteran's service to our nation, they continue to make significant contributions to Minnesota's economy and communities as well. Northwest Minnesota is fortunate to have an above average share of veterans in our region. According to the 2020 American Community Survey, Northwest Minnesota is home to an estimated 38,000 veterans, approaching 9% of the region's adult population, compared to 6.8% statewide. Cass and Hubbard Counties have over 11% veterans, among the highest of the 87 counties in the state, while Becker, Clearwater, and Crow Wing are all over 10% (see Table 1.)
| Table 1: Northwest Minnesota Veteran Population and Labor Force | ||||||
|---|---|---|---|---|---|---|
| County | Civilian Population | |||||
| Age 18 and Over | Age 18 to 64 | |||||
| Total | Veterans | Veterans as a Percent of Total | Veterans in the Labor Force | Labor Force Participation Rate | ||
| Veterans | Non-Veterans | |||||
| Becker | 25,899 | 2,725 | 10.5% | 909 | 83.6% | 81.4% |
| Beltrami | 34,988 | 2,865 | 8.2% | 980 | 75.8% | 77.1% |
| Cass | 23,244 | 2,635 | 11.3% | 622 | 72.6% | 77.4% |
| Clay | 48,200 | 2,854 | 5.9% | 1,189 | 84.9% | 82.4% |
| Clearwater | 6,668 | 696 | 10.4% | 216 | 74.7% | 77.8% |
| Crow Wing | 50,756 | 5,059 | 10.0% | 1,483 | 72.3% | 79.8% |
| Douglas | 29,707 | 2,691 | 9.1% | 949 | 84.1% | 85.9% |
| Grant | 4,591 | 404 | 8.8% | 78 | 76.5% | 84.8% |
| Hubbard | 16,815 | 1,953 | 11.6% | 525 | 84.0% | 79.1% |
| Kittson | 3,364 | 295 | 8.8% | 112 | 91.1% | 85.7% |
| Lake of the Woods | 3,001 | 255 | 8.5% | 70 | 69.3% | 84.3% |
| Mahnomen | 3,784 | 284 | 7.5% | 65 | 76.5% | 72.1% |
| Marshall | 7,203 | 562 | 7.8% | 208 | 88.1% | 82.6% |
| Morrison | 25,197 | 2,409 | 9.6% | 798 | 75.3% | 84.1% |
| Norman | 4,929 | 389 | 7.9% | 98 | 71.0% | 81.0% |
| Otter Tail | 45,711 | 3,920 | 8.6% | 1,007 | 82.5% | 83.1% |
| Pennington | 10,832 | 814 | 7.5% | 289 | 85.3% | 85.0% |
| Polk | 23,713 | 1,936 | 8.2% | 482 | 69.9% | 81.4% |
| Pope | 8,808 | 860 | 9.8% | 203 | 84.9% | 84.6% |
| Red Lake | 3,024 | 265 | 8.8% | 93 | 83.8% | 81.0% |
| Roseau | 11,576 | 884 | 7.6% | 386 | 85.2% | 84.4% |
| Stevens | 7,691 | 299 | 3.9% | 61 | 67.0% | 83.0% |
| Todd | 18,719 | 1,606 | 8.6% | 330 | 63.1% | 77.8% |
| Traverse | 2,627 | 261 | 9.9% | 55 | 80.9% | 84.1% |
| Wadena | 10,160 | 780 | 7.7% | 163 | 65.2% | 79.8% |
| Wilkin | 4,899 | 305 | 6.2% | 92 | 76.0% | 83.3% |
| Northwest Minnesota | 436,106 | 38,006 | 8.7% | 11,314 | 78.0% | 81.4% |
| Minnesota | 4,297,294 | 291,453 | 6.8% | 101,620 | 80.9% | 83.5% |
| Source: American Community Survey Five-year estimates, 2016-2020 | ||||||
The U.S. Census Bureau American Community Survey provides estimates from five years of survey data of the number of veterans and non-veterans aged 18 to 64 in the labor force, that is, either working or actively seeking work. Similar to the state, veteran labor force participation in the Northwest region is slightly lower than for non-veterans. While many factors can contribute to this, the larger share of veterans with a disability is a foremost reason. An estimated 33.6% of Northwest Minnesota veterans aged 18 to 64 have a disability, compared to 14.5% of non-veterans. The labor force participation rate (LFPR, which is labor force as a share of the population) is significantly lower for the population of individuals with a disability.
In Northwest Minnesota, the LFPR of the population aged 20 to 64 with a disability is 50%, compared to 82% for the total Northwest Minnesota population aged 20 to 64. The fact that veterans have just 3.4 percentage points lower LFPR, 78.0% compared to 81.4% for non-veterans, while more than double the share with a disability is remarkable. Also, while the LFPR in Minnesota is higher for both veterans and non-veterans, it is also notable that an estimated 28.6% of veterans statewide have a disability compared to the 33.6% in the Northwest Region.
Veterans return from service with a vast array of unique skills and experiences. They will continue to be an invaluable resource for local employers looking for quality, well trained candidates. The entire Northwest Region serves to benefit. If you are a veteran looking to transition to a civilian job, try O*NET's My Next Move For Veterans website. One tool on this site matches military classifications with similar civilian careers, allowing veterans to leverage their experience and skills gained while serving.
More importantly, the Minnesota Department of Employment and Economic Development (DEED) has a team dedicated to serving Minnesotan veterans and their needs. Check out the CareerForce Veterans Employment Services page to find your regional contact and how they might help you or a veteran you know. DEED also assists employers hiring veterans.
It is an auspicious coincidence for Northwest Minnesota that November is both the month that features Veterans Day as well as being Native American and Indigenous Peoples Heritage Month because 2.9% of Northwest Minnesota's veteran population is American Indian or Alaskan Native Alone, compared to 1% statewide. This is the highest of any of Minnesota's six Planning Regions. Also, 28.6% of Mahnomen County veterans and 14.4% of Beltrami County veterans are American Indian, the two highest shares in Minnesota.
Contact Anthony Schaffhauser at 320-441-6594.
