 The presence of such industry powerhouses as Polaris, Arctic Cat and New Flyer make Northwest Minnesota a hub of transportation equipment manufacturing.
From wheat and potatoes to soybeans and sugar beets, the region is a major producer and processor of food staples and specialty agricultural products.
Want the freshest data delivered by email? Subscribe to our regional newsletters.
10/27/2023 9:00:00 AM
Anthony Schaffhauser
Wages for jobs in Northwest Minnesota have increased to entice workers to fill open positions, with median wage offers for job vacancies climbing 4.7% per year from 2019 to 2022. However, wages for filled positions have increased even more, with the median wage for all jobs increasing 6.1% per year from 2019 to 2022. According to the Consumer Price Index (CPI), inflation was running at a 4.4% annual rate from 2019 to 2022. Thus, growth in wage offers is only slightly more than a cost-of-living increase, while growth in wages for employed workers is a more substantial increase in purchasing power. Employers have increased wages to keep their current employees in a tight labor market.
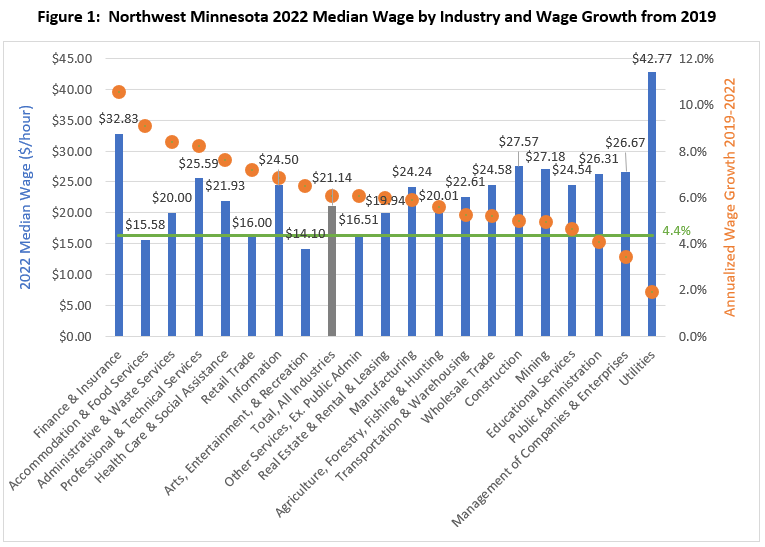
The 6.1% annual increase in median wage statistic comes from DEED's Quarterly Employment Demographics (QED) data. Figure 1 displays 2022 QED median wage comparison by industry sector and annual wage growth from 2019 to 2022. The green horizontal line is CPI annual inflation of 4.4% over the three years from 2019 to 2022.

These data are unique in providing wage rate comparisons across industries and over time. QED median hourly wages are derived from administrative Unemployment Insurance (UI) records. Unlike survey-derived wage data, QED does not have sampling error interfere with comparisons of wage levels over time. Quarterly Census of Employment and Wages (QCEW) are also derived from UI records, providing employment and payrolls that tell us average paychecks. However, QCEW does not indicate if paychecks differ due to differences in hours worked or rates of pay. Thus, QED provides unique insights into hourly wage changes over time and by industry.
One insight is that wage growth exceeded inflation overall and across all but three industries, except for Public Administration, Management of Companies, and Utilities. Additionally, the industry sectors are ordered by wage growth from left to right, and generally the lowest wage industries tended to have faster wage growth. Sectors with a lower median wage that exceeded average wage growth across all industries include Arts, Entertainment & Recreation, Accommodation & Food Services, Retail Trade, and Administrative & Waste Services. The Other Services sector had a lower median wage and matched the wage growth of All Industries. Of the industries that exhibited slower wage growth than the total of all industries, only Real Estate & Rental & Leasing and Agriculture, Forestry, Fishing & Hunting had slower wage growth, and wage growth was only slightly slower at 5.9% and 5.6%, respectively.
Some higher wage service industries also had fast wage growth. Finance & Insurance had the fastest wage growth and the second highest median wage. Drilling down to the subsector level, this exceptional wage growth was driven by 11.5% annual wage growth in Credit Intermediation & Related Activity (mostly banks and credit unions). However, this subsector also had a 4.6% drop in employment from 2019 to 2022. A contact in the banking industry informs me that customers accelerated use of online banking apps during the pandemic, reducing the need for tellers which have lower wages compared to other banking occupations. Based on that anecdotal information,a lot of this apparent wage growth may be a decrease in lower-paid employment.
Professional & Technical Services also had a higher median wage and fast wage growth, but employment decreased 4% over this time. This could be another case where employment of lower wage workers declined, thereby increasing the industry's median wage. Finally, Health Care & Social Assistance had a slightly higher median wage than all industries and 7.6% annual wage growth. However, it is worth noting that the Nursing & Residential Care Facilities subsector had a $15.06 median wage and 8.5% average wage growth.
QED data is indispensable for comparing median wages across industries and over time. It also provides the percentage of jobs, median wage, and median hours worked by age and sex. This blog does not demonstrate all the demographic analysis possibilities of these data.
Contact Anthony Schaffhauser at anthony.schaffhauser@state.mn.us.