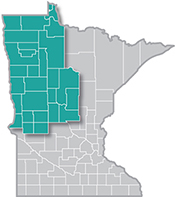
 The presence of such industry powerhouses as Polaris, Arctic Cat and New Flyer make Northwest Minnesota a hub of transportation equipment manufacturing.
From wheat and potatoes to soybeans and sugar beets, the region is a major producer and processor of food staples and specialty agricultural products.
Want the freshest data delivered by email? Subscribe to our regional newsletters.
12/19/2023 9:00:00 AM
Anthony Schaffhauser
As we approach the end of 2023, it is exciting to point out that this is the first year where Northwest Minnesota employment has surpassed pre-pandemic levels. According to DEED's Quarterly Census of Employment & Wages (QCEW) program, job counts in the first quarter of 2023 exceeded first quarter 2020 employment (reflecting employment just before the pandemic) by 1,042 jobs, or 0.5%,. The recently released second quarter 2023 QCEW data further established this landmark with employment inching above second quarter 2019 by 426 jobs, or 0.2%. Statewide, employment was essentially tied with second quarter 2019, averaging just 37 fewer jobs in second quarter 2023, or just one thousandth of one percent lower (see Figure 1.)

Prior to the pandemic, total employment steadily increased in the longest running economic expansion on record. Employment then quickly bottomed out in second quarter 2020, along with the end of the Pandemic Recession. The recovery quickly ensued, followed by steadily increasing employment from second quarter 2021 to 2023.
With the employment recovery complete, it once again becomes useful to look for industry employment trends. Before the pandemic, employment was steadily growing overall, but some industries were growing, some were flat, and some were declining. The Pandemic Recession overwhelmed these trends, and we can just now begin to look for signs if the previous industry trends are reasserting themselves or if different industry employment trends are emerging. Analyzing these industry employment trends is useful to know where employment opportunities are increasing.
Table 1 displays industry employment for second quarter 2015, 2019, and 2023, as well as the changes leading up to the pandemic and the changes during the recovery. We see that from 2015 to 2019, eight of the 20 sectors had significantly above average growth: Health Care & Social Assistance, Manufacturing, Educational Services, Accommodation & Food Services, Public Administration, Other Services, Agriculture, and Professional & Technical Services. Of these, only Manufacturing, Other Services, and Agriculture have clearly continued their growth trend, with above average growth from 2019 to 2023 (see Table 1).
Table 1: Northwest Minnesota Industry Employment, Second Quarter
| NAICS Industry Title | Jobs, Q2 2015 | Jobs, Q2 2019 | Jobs, Q2 2023 | Q2 2015 - Q2 2019 Change | Q2 2019 - Q2 2023 Change | ||
|---|---|---|---|---|---|---|---|
| Jobs | Percent | Jobs | Percent | ||||
| Total, All Industries | 221,514 | 226,774 | 227,200 | +5,260 | +2.4% | +426 | +0.2% |
| Health Care & Social Assistance | 36,676 | 39,177 | 38,849 | +2,501 | +6.8% | -328 | -0.9% |
| Manufacturing | 28,672 | 29,688 | 30,285 | +1,016 | +3.5% | +597 | +2.2% |
| Retail Trade | 28,225 | 28,177 | 28,374 | -48 | -0.2% | +197 | +0.8% |
| Educational Services | 22,597 | 23,721 | 23,325 | +1,124 | +5.0% | -396 | -1.9% |
| Accommodation & Food Services | 21,518 | 23,030 | 22,863 | +1,512 | +7.0% | -167 | -1.2% |
| Public Administration | 15,571 | 16,606 | 15,523 | +1,035 | +6.6% | -1,083 | -6.8% |
| Construction | 11,470 | 11,837 | 13,257 | +367 | +3.2% | +1,420 | +11.8% |
| Wholesale Trade | 11,717 | 11,386 | 11,758 | -331 | -2.8% | +372 | +3.4% |
| Other Services | 6,560 | 6,830 | 7,033 | +270 | +4.1% | +203 | +4.1% |
| Transportation & Warehousing | 6,369 | 5,996 | 5,933 | -373 | -5.9% | -63 | -1.1% |
| Finance & Insurance | 5,771 | 5,921 | 5,849 | +150 | +2.6% | -72 | -1.2% |
| Agriculture, Forestry, Fish & Hunting | 4,877 | 5,190 | 5,339 | +313 | +6.4% | +149 | +2.8% |
| Professional & Technical Services | 4,411 | 4,814 | 4,615 | +403 | +9.1% | -199 | -4.4% |
| Admin. Support & Waste Mgmt. Svcs. | 5,211 | 4,223 | 4,070 | -988 | -19.0% | -153 | -4.0% |
| Arts, Entertainment, & Recreation | 5,040 | 3,826 | 3,869 | -1,214 | -24.1% | +43 | +2.0% |
| Information | 2,866 | 2,592 | 2,620 | -274 | -9.6% | +28 | +1.3% |
| Real Estate & Rental & Leasing | 1,467 | 1,511 | 1,556 | +44 | +3.0% | +45 | +3.1% |
| Utilities | 1,326 | 1,292 | 1,280 | -34 | -2.6% | -12 | -1.0% |
| Management of Companies | 884 | 712 | 560 | -172 | -19.5% | -152 | -23.7% |
| Mining | 282 | 238 | 237 | -44 | -15.6% | -1 | -0.4% |
| Source: DEED Quarterly Census of Employment and Wages | |||||||
Generally, goods producing sectors were less affected by the pandemic than services. The Construction sector was even boosted by the pandemic, adding jobs in 2020 and hitting a peak in 2021. It took a breather in 2022 but increased again in 2023 and added the most jobs of any industry since 2019. Thus, Construction has far exceeded its pre-pandemic trend, which was only slightly above average employment growth. Construction also shored up Mining employment, as Mining mainly supplies construction with sand and gravel in the Northwest. Agriculture employment was largely unaffected by the pandemic, increasing statewide every year since 2019. Agriculture experienced a relatively small dip in Northwest in 2021, dropping 2.6% below 2019 levels, but in 2022 had advanced 2.1% above 2019. Manufacturing had also exceeded 2019 employment by 2022, handily overcoming a 9.6% dip from 2019 to 2020.
Of all the services providing sectors, Other Services had the fastest growth coming out of the recession. With employment exceeding 2019 levels in 2022 and adding even more jobs in 2023, it exactly matched it's 2015 to 2019 growth rate. In contrast, statewide it remains 2.9% below 2019. Wholesale Trade grew second fastest of the services, initiating a new growth trend after declining from 2015 to 2019. This is also what happened statewide with Wholesale Trade. It makes sense that it would trend up with Agriculture and Manufacturing. While Transportation & Warehousing employment did not trend up with Wholesale Trade as it did statewide, the employment decline did moderate in the Northwest since the pandemic.
Health Care & Social Assistance peaked in 2018 and has yet to reestablish a growth trend in Northwest, declining in 2022 and remaining below 2021 in 2023. Statewide, Health Care continued growing from 2018 to 2019, and in 2023 it exceeded 2019. The Nursing & Residential Care Facilities subsector has a larger share of employment in the Northwest, so challenges recruiting and retaining employees in this subsector is holding back employment. Thus, healthcare worker demand is intact, but is in large part unfilled. Like Health Care, difficulty hiring and retaining workers is holding back Retail Trade employment. Retail Trade is characterized by stable employment since peaking in 2016.
Both Educational Services and Accommodation & Food Services are on track to eventually regain their pre-pandemic employment. Employment has increased every year since 2020, but is still not fully back. In contrast, Public Administration is off track from its prior trend and is the furthest from 2019 job counts of any sector. That is unique to the region, as statewide, job counts are now slightly above 2019.
Finance & Insurance had nearly average growth prior to the pandemic, but has trended down since 2019. Statewide, Finance & Insurance also flipped from growth to decline since 2019. Professional & Technical Services diverges from statewide, which is 5.6% above 2019, and is also off track from the prior growth trend in the Northwest. It rebounded somewhat in 2021 but pulled back in 2022 and remains below pre-pandemic levels. This is notable, since the industry had the fastest growth from 2015 to 2019 of any Northwest sector. However, both Finance & Insurance and Professional & Technical Services had some of the fastest wage growth since the pandemic, even while employment was declining. This implies that these industries are relying less on lower paid employees.
Arts, Entertainment & Recreation has recovered from the pandemic, even growing slightly after trending down from its 2015 peak employment prior to the pandemic. Likewise for Information, which includes publishing (newspapers) and broadcasting, libraries, and telecommunications, it is up slightly compared to 2019 job counts. Real Estate & Rental & Leasing maintained its pre-pandemic employment trend, quickly exceeding the 2019 level in 2021. Statewide, all three of these industries have yet to regain 2019 employment levels.
Employment declines for Utilities continued but moderated in the Northwest since the pandemic, whereas statewide utilities employment switched from decline to growth. Finally, Management of Companies (which includes corporate headquarters and holding companies) had the fastest employment decline both before and after the pandemic. In contrast, statewide employment had been growing in this sector from 2016 to 2019, and it reached a new high in 2023.
Overall, only a few industries (Manufacturing, Other Services, and Agriculture) have reestablished their above average growth trends so far. Education and Accommodation & Food Services are progressing back, as is Health Care & Social Assistance, but with unique challenges in the Residential & Nursing Care Facilities subsector. Construction and Wholesale Trade established new growth trends, and are leading prosperity in the region. As we approach 2024, the pandemic impacts on employment are fading and new trends are emerging.
Contact Anthony Schaffhauser at anthony.schaffhauser@state.mn.us.
