 The presence of such industry powerhouses as Polaris, Arctic Cat and New Flyer make Northwest Minnesota a hub of transportation equipment manufacturing.
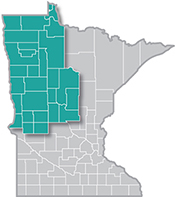
From wheat and potatoes to soybeans and sugar beets, the region is a major producer and processor of food staples and specialty agricultural products.
Want the freshest data delivered by email? Subscribe to our regional newsletters.
1/26/2024 9:00:00 AM
Anthony Schaffhauser
My last blog identified the effects of the pandemic on industry employment trends. This month, I examine how workforce trends were impacted by the pandemic and show that caregiving is a major underlying factor.
To use the most current data available, I take the annual average beginning-of-quarter employment for second quarter 2022 through first quarter 2023, which was recently released. Since it covers four quarters, I'll call this annual employment up to the first quarter of the year "year to first quarter." Looking at four quarters of employment data is necessary due to the huge seasonal employment declines in first quarter, for example in Construction and Leisure & Hospitality.
Granted, it is odd to think about a year ending in the first quarter rather than the fourth quarter. However, with the pandemic hitting in March 2020, this actually captures the pre-pandemic workforce trends as close to the start of the pandemic as possible. Comparing year to first quarter 2017 to 2020 provides the pre-pandemic trend, then comparing year to first quarter 2020 to 2023 shows the change in trend after the pandemic.
Table 1 shows the changes by age and sex. This shows the same trends from 2020 to 2023 as the previous blog: Youth and Seniors Entered Northwest Minnesota's Workforce in the Pandemic Recovery; Caregivers Exited. The addition of three more quarters of data of ongoing recovery did not reverse these trends identified with data through second quarter 2022. However, Table 1 does show that some of these changes were consistent with changes already occurring prior to the pandemic, while others are completely different.
Looking just at age groups, workers aged 22 to 34 were decreasing from 2017 to 2020 as the large Millennial cohort aged 20 to 36 were turning age 23 to 39. Likewise, the 6.9% decrease in the 45 to 54 year old group from 2017 to 2020 reflects the youngest Boomers aging from 53 to 56 while the much smaller Generation X cohort moved into this group. From 2020 to 2023, the 7.5% decrease in workers aged 55 to 64 reflects aging Boomers turning age 59 to 77. The slowing growth of workers aged 65 years and over, from 17.9% to 5.7% growth over the two time periods, reflects the much lower workforce participation of people in their mid-70s (see Table 1).
| Table 1: Average Annual Employment by Age and Sex to First Quarter 2017, 2020, and 2023 | |||||||
|---|---|---|---|---|---|---|---|
| Age | Year to First Quarter |
2017-2020 Change in Jobs |
2020-2023 Change in Jobs | ||||
| 2017 | 2020 | 2023 | Number | Percent | Number | Percent | |
| All | 221,622 | 226,089 | 221,157 | +4,468 | +2.0% | -4,933 | -2.2% |
| 14-18 years | 9,650 | 10,170 | 11,926 | +520 | +5.4% | +1,756 | +17.3% |
| 19-21 years | 12,101 | 12,373 | 11,706 | +272 | +2.2% | -667 | -5.4% |
| 22-24 years | 12,620 | 12,345 | 11,600 | -275 | -2.2% | -745 | -6.0% |
| 25-34 years | 43,901 | 43,662 | 41,192 | -239 | -0.5% | -2,470 | -5.7% |
| 35-44 years | 42,194 | 45,730 | 46,376 | +3,536 | +8.4% | +647 | +1.4% |
| 45-54 years | 44,465 | 41,392 | 40,234 | -3,073 | -6.9% | -1,158 | -2.8% |
| 55-64 years | 42,373 | 43,535 | 40,270 | +1,162 | +2.7% | -3,265 | -7.5% |
| 65 years + | 14,320 | 16,884 | 17,854 | +2,564 | +17.9% | +970 | +5.7% |
| Female | 116,123 | 118,989 | 113,741 | +2,867 | +2.5% | -5,249 | -4.4% |
| 14-18 years | 5,348 | 5,541 | 6,618 | +193 | +3.6% | +1,077 | +19.4% |
| 19-21 years | 6,471 | 6,565 | 6,109 | +93 | +1.4% | -456 | -6.9% |
| 22-24 years | 6,408 | 6,238 | 5,739 | -170 | -2.7% | -500 | -8.0% |
| 25-34 years | 21,884 | 22,028 | 20,279 | +144 | +0.7% | -1,749 | -7.9% |
| 35-44 years | 21,604 | 23,840 | 23,513 | +2,236 | +10.4% | -327 | -1.4% |
| 45-54 years | 23,955 | 22,347 | 21,162 | -1,608 | -6.7% | -1,185 | -5.3% |
| 55-64 years | 23,282 | 24,013 | 21,449 | +731 | +3.1% | -2,564 | -10.7% |
| 65 years + | 7,170 | 8,418 | 8,873 | +1,248 | +17.4% | +455 | +5.4% |
| Male | 105,500 | 107,100 | 107,417 | +1,600 | +1.5% | 317 | +0.3% |
| 14-18 years | 4,302 | 4,629 | 5,309 | +327 | +7.6% | +681 | +14.7% |
| 19-21 years | 5,630 | 5,808 | 5,597 | +178 | +3.2% | -211 | -3.6% |
| 22-24 years | 6,212 | 6,106 | 5,862 | -106 | -1.7% | -245 | -4.0% |
| 25-34 years | 22,017 | 21,634 | 20,913 | -383 | -1.7% | -722 | -3.3% |
| 35-44 years | 20,589 | 21,890 | 22,863 | +1,300 | +6.3% | +974 | +4.4% |
| 45-54 years | 20,510 | 19,045 | 19,072 | -1,465 | -7.1% | +27 | +0.1% |
| 55-64 years | 19,091 | 19,522 | 18,821 | +431 | +2.3% | -702 | -3.6% |
| 65 years + | 7,149 | 8,466 | 8,981 | +1,316 | +18.4% | +516 | +6.1% |
| Source: U.S. Census Bureau, Center for Economic Studies, LEHD Quarterly Workforce Indicators | |||||||
This most definitely does not mean that the pandemic had little workforce impact. The overall workforce went from growth to decline. The big exception was the youngest workers, aged 14 to 18 years, which experienced drastically accelerated workforce growth. Higher wages for increasingly available entry-level jobs, combined with strong immune systems, brought increasing numbers of high schoolers and recent high school graduates into the workforce.
Most notably, the overall decline from 2020 to 2023 was from females. Male workers in total had slight (0.3%) growth. We can get a clearer picture of the pandemic impacts by looking at the change in the percent of the workforce that is female by age (see Figure 1). Note that we don't need to show males because it is just the balance of the percentage. For example, 51.4% females in 2023 is 48.6% males. Note also that these data do not include self-employment, which is more common for males.

The increasing share of females in the workforce from 2017 to 2020 reversed to a significant decline from 2020 to 2023. Within the 14 to 18 year old age group, the trend went from decreasing to increasing, and was slightly above the female share in 2017 by 2023. The 19 to 24 age groups reflect a continuation of the pre-pandemic declining trend, although the 22 to 24 year old group takes a sharper drop into 2023. To some extent, this reflects increases in female college enrollment relative to males.
Overall, the pandemic-induced workforce decline is concentrated in the age 25 to 64 year age groups. Every age group went from an increasing share to a sharply declining share. These are the age groups most likely to be caring for kids, grandkids, and elderly parents. No doubt, many males left the workforce for caregiving as well, but the stark change in trend in the female shares of the workforce in these ages serve to isolate caregiving as the primary pandemic impact on the workforce.
This analysis implies that the workforce growth is held back by caregiving demands, sharpening the focus on child care and elder care. This also points out the potential of employee recruitment and retention strategies focused on schedule flexibility.
Contact Anthony Schaffhauser at anthony.schaffhauser@state.mn.us.
