 The presence of such industry powerhouses as Polaris, Arctic Cat and New Flyer make Northwest Minnesota a hub of transportation equipment manufacturing.
From wheat and potatoes to soybeans and sugar beets, the region is a major producer and processor of food staples and specialty agricultural products.
Want the freshest data delivered by email? Subscribe to our regional newsletters.
2/22/2024 9:00:00 AM
Anthony Schaffhauser
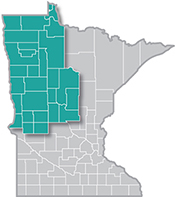
The cost of housing is a big and growing portion of most household budgets. The increasing cost of housing has been a major contributor to the inflation experienced over the past few years. So, how much more of Northwest Minnesota residents' income is going toward housing compared to the past? We can compare American Community Survey (ACS) housing cost and income data from 2017 to 2022 to help answer this question.
First, let me explain and quantify "housing has been a major contributor to inflation experienced over the past few years." Over the four years from 2018 to 2022, inflation as measured by the Consumer Price Index (CPI) was running at a 3.9% annual rate, while the shelter component of CPI increased at a 3.6% annual rate. So, it seems shelter cost increases have been less of a burden than overall inflation. However, the weight of shelter in the CPI increased from 32.4% to 36.2% from 2018 to 2022. That means the typical U.S. consumer paid 3.8% more of total monthly expenditures for shelter. Thus, even though housing costs increased less than prices overall, the budget impact was higher.
How much of inflation was due to shelter cost? Shelter contributed 22.8% of the total inflation from 2018 to 2022. In contrast, shelter accounted for only 7.3% of the CPI increase from 2013 to 2017, with inflation running at a 1.3% annual rate and shelter's weight increasing less than 0.4% over these years. Note that most recently shelter was responsible for over 50% of December 2023's inflation. So, the importance of housing cost has not diminished.
Given the impact of shelter on the CPI, has housing cost inflation been eating up an increasing share of Northwest Minnesota resident's income? The answer is no, at least according to Census data, and that is welcome news. Table 1 shows the percent of household income going to monthly housing cost for homeowners with and without a mortgage, as well as for renters.
| Table 1: Housing Cost as a Share of Household Income, 2017 and 2022 | |||||||
|---|---|---|---|---|---|---|---|
| Units | Northwest Minnesota | Minnesota | U.S. | ||||
| 2022 Number | 2022 Percent | 2017 Percent | 2022 Percent | 2017 Percent | 2022 Percent | 2017 Percent | |
| Occupied Housing Units | 234,561 | 100.0% | 100.0% | 100.0% | 100.0% | 100.0% | 100.0% |
| Owner-Occupied | 179,053 | 76.3% | 76.1% | 72.3% | 71.6% | 64.8% | 63.8% |
| With Mortgage | 101,673 | 56.8% | 58.0% | 65.0% | 67.1% | 61.5% | 63.5% |
| Selected Monthly Owner Costs Percent of Household Income | |||||||
| Less than 25.0% | 64.7% | 63.5% | 68.0% | 65.7% | 62.6% | 59.7% | |
| 25.0% to 34.9% | 16.7% | 17.9% | 16.1% | 17.5% | 16.8% | 18.1% | |
| 35% or More | 18.5% | 18.7% | 15.8% | 16.8% | 20.6% | 22.3% | |
| Without Mortgage | 77,380 | 43.2% | 42.0% | 35.0% | 32.9% | 38.5% | 36.5% |
| Selected Monthly Owner Costs Percent of Household Income | |||||||
| Less than 25.0% | 83.6% | 83.2% | 84.9% | 84.2% | 82.3% | 81.5% | |
| 25.0% to 34.9% | 6.8% | 7.2% | 6.0% | 6.8% | 6.9% | 7.6% | |
| 35% or More | 9.5% | 9.5% | 9.1% | 7.2% | 10.8% | 10.9% | |
| Renter-Occupied | 55,508 | 23.7% | 23.9% | 27.7% | 28.4% | 35.2% | 36.2% |
| Monthly Rent (plus utilities if not included) Percent of Household Income | |||||||
| Less than 25.0% | 43.5% | 40.7% | 40.9% | 40.9% | 38.5% | 37.9% | |
| 25.0% to 34.9% | 22.4% | 20.8% | 22.0% | 21.5% | 20.7% | 20.6% | |
| 35% or More | 34.1% | 38.5% | 37.1% | 37.6% | 40.8% | 41.5% | |
| Source: American Community Survey 5-Year Estimates, 2013-2017 and 2018-2022 | |||||||
The share of Northwest households with a mortgage spending from 25% up to 35% of income decreased from 17.9% to 16.7% from 2017 to 2022. That 1.7% decrease produced a roughly equivalent gain in households spending less than 25% of income on housing, with those spending 35% or more remaining about the same (with a slight discrepancy due to rounding). In other words, a larger percentage of Northwest households with a mortgage spent less than 25% of income on housing cost, compared to national numbers.
Even then, data show that housing costs increased, as just under 69% of Northwest households with a mortgage spent $1,000 or more on monthly housing costs in 2017 compared to just under 82% in 2022. However, incomes also increased, which kept housing affordability in line. Median household income was $53,847 in 2017, compared to $67,528 in 2022. Taken together, income gains outweighed housing cost increases.
This was also true but for a much lesser extent for homeowner households without a mortgage. The share of households paying less than 25% of income for housing increased slightly (0.3%) from 2017 to 2022. No doubt many without a mortgage are retired and did not benefit from wage gains that exceeded inflation.
Comparing to statewide, the share of Minnesota households with a mortgage paying less than 25% of income for housing increased even more than in the Northwest, meaning a larger share were paying less of their income. While the share paying from 25% up to 35% in Minnesota declined only slightly more than in the Northwest (-1.4% compared to -1.2%), Minnesota also had a decrease of 1% in the percentage of households paying 35% or more. Minnesota started with a larger share of less than 25% mortgage households, and the gap widened from 2017 to 2022.
Compared to the U.S., both Minnesota and Northwest have a larger share of mortgage households in the less than 25% group and a smaller share in the 35% or more group. To summarize the comparisons for mortgage households, Minnesota has a lower relative housing cost burden than the Northwest, and the Northwest has a lower relative housing cost burden than the U.S. However, Minnesota's advantage in housing cost burden narrowed slightly compared to the U.S. from 2017 to 2022. The Northwest's advantage in housing cost burden narrowed even more compared to the U.S.
For Minnesota compared to the U.S., the lower cost burden for households with a mortgage is due to higher incomes in Minnesota, where a majority of residents live in the Twin Cities area. Minnesota's median household income was $84,313 compared to $75,149 for the U.S., while median housing costs for households with a mortgage were essentially the same at $1,818 in Minnesota compared to $1,828 in the U.S.
For the Northwest compared to the U.S., the lower cost burden is due to lower housing costs. Nearly 88% of U.S. households with a mortgage pay over $1,000 per month in housing costs compared to, as mentioned above, just under 82% for Northwest, and with a lower median income at $67,528 in the Northwest. To summarize, there is a lower housing cost burden in the Northwest compared to the U.S. because the lower housing cost more than makes up for the lower incomes of households with a mortgage.

Switching focus to renters, the Northwest has a lower percent paying 35% or more of their income for rent and utilities than Minnesota and the U.S. The renter costs are designed to be comparable to home ownership. A greater percent of renters' income goes to housing costs than homeowners for the Northwest, Minnesota, and the US. However, the good news is that Northwest renters paying more than 35% of income declined more than Minnesota statewide and the U.S., with the 4.4% drop redistributed as a 1.6% gain in the 25% up to 35% group and a 2.8% gain in the less than 25% group. This brings the renter housing cost burden in the Northwest from higher than statewide in 2017 to lower than Minnesota statewide in 2022.
To wrap up, the CPI shows an increasing share of nationwide expenditures for shelter. Using ACS data on household income and housing cost, I show that in Northwest Minnesota this trend has not been gobbling up all the income growth from 2017 to 2022. Income gains outweighed housing cost increases in the Northwest, Minnesota statewide, and the U.S. The gains were realized most by homeowners with a mortgage. No doubt this reflects the fact that most homeowners have a fixed rate mortgage, paid with income that inflated.
However, the housing cost burden for Northwest Minnesota mortgage households is higher than statewide, and the gap widened from 2017 to 2022. The Northwest's lower housing cost provides a cost burden advantage over the U.S., but this advantage narrowed from 2017 to 2022. Renter households have a higher housing cost burden than homeowners in the Northwest, Minnesota, and the U.S. The Northwest's burden for renters is lowest, and this advantage increased from 2017 to 2022. While this is good news, bear in mind that the highest rent places are in large cities, not rural areas like the Northwest. One should also bear in mind that the good news about incomes outpacing housing cost does not mean that there is enough housing, nor does it reflect the situation for aspiring homebuyers.
Contact Anthony Schaffhauser at anthony.schaffhauser@state.mn.us.
