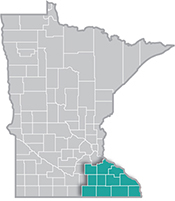
 Southeast Minnesota is a health care and agricultural powerhouse. The region is home to the renowned Mayo Clinic and some of the world's most recognized food companies and brands.
Advanced manufacturing is especially strong here, with machinery, chemicals, and electronics among the top products.
Want the freshest data delivered by email? Subscribe to our regional newsletters.
8/23/2017 9:47:04 AM
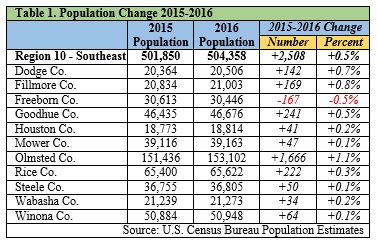
The Southeast Minnesota region saw some notable changes over the past year that show up in the newly updated Regional Profile, posted on DEED's Regional Labor Market page. From 2015 to 2016, Southeast Minnesota welcomed just over 2,500 new residents, a 0.5 percent rise. Olmsted County saw the largest gain in population with over 1,600 new residents, an increase of 1.1 percent. While only Freeborn County lost population in the past year, four of the 11 counties in the region lost population from 2000 to 2016 – Fillmore, Freeborn, Houston, and Wabasha.
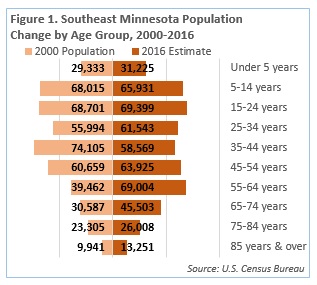
Southeast Minnesota's population was aging, with significant shifts as the baby boom generation moves through the population pyramid. While the number of people in the youngest age groups remained about the same in 2016 compared to 2000, the region saw huge increases in the number of people aged 55 years and older against big declines in the 35- to 54-year-old age group. The region had nearly 30,000 more people in the 55- to 64-year age group and about 15,000 additional people in the 65- to 74-year old age group (Figure 1). If the trend of rapidly increasing older populations combined with stable or declining younger and working-aged populations continues, it will have strong implications for employers who are already struggling to find workers to fill current vacancies.
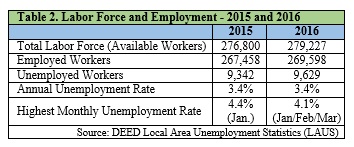
Much like population, the region's labor force also saw an increase in the last year, jumping by just over 2,425 additional workers, including 2,140 more employed individuals. And while the average annual unemployment rate remained at 3.4 percent for both years, the number of unemployed residents also saw an increase of almost 300 (Table 2).
Southeast Minnesota has relatively high labor force participation rates and relatively low unemployment rates (Table 3). The region's overall labor force participation rate dropped in the past year, mostly due to the aging of the workforce, but is just under the state rate of 70 percent. However, the region's participation rates were higher than the state's in all but one age group, especially for workers aged 45 years and over.
Though things improved in 2016, racial disparities in labor force participation rates and unemployment rates in the state and region continue. Participation rates for Black or African Americans, Asians, individuals of some other race, and those who identify as Hispanic or Latino all increased in Southeast Minnesota, while rates for whites, American Indian or Alaskan Natives, and those of two or more races saw a decrease in labor force participation rates. And every race group except American Indian or Alaskan Natives saw a decrease in their unemployment rate.
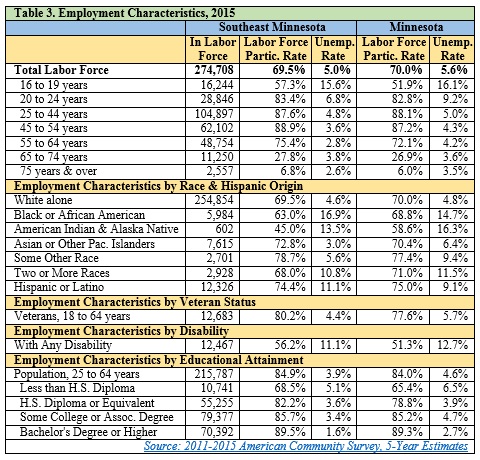
Veterans, individuals with disabilities, and workers across all levels of education also saw decreases in their unemployment rates over the past year; while workers with disabilities saw an increase in participation rates.
Surprisingly, the estimated basic needs cost of living for families in Southeast Minnesota dropped over the last year. While the decrease was just $420 – more than enough to cover one month of average health care or child care costs, or half of an average house payment – that could be significant to a family. While some monthly costs went up, including child care and housing, all other costs decreased (Table 4).

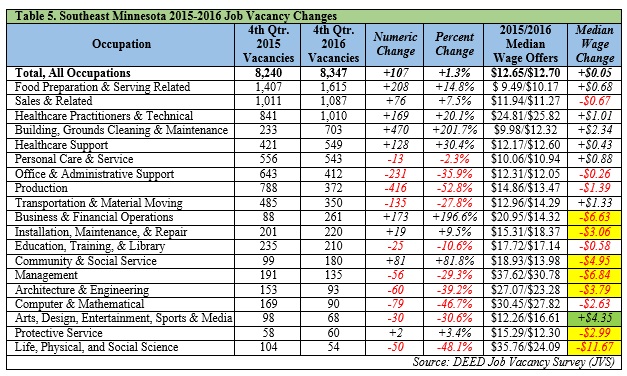
Unfortunately, while the cost of living went down, so did the median wage offers of many job vacancies (Table 5). Wage offers increased by just $0.05 across all vacancies, but saw notable increases for many of the largest in-demand occupations – including food preparation and serving, health care practitioners, building and grounds cleaning and maintenance, health care support, and personal care and service. Even with the increases, however, only health care practitioners had median wage offers above the cost of living required wage of $15.52 per hour.
Additionally, the number of vacancies dropped from 2015 to 2016 in 10 of the 19 occupational groups, according to DEED's Job Vacancy Survey, including a decrease of 416 vacancies in production, which is unfortunate given the prominence of manufacturing, and a loss of 231 vacancies in office and administrative support. However, there were large gains in the number of vacancies in food preparation and serving related jobs and building and grounds cleaning and maintenance positions. In total, the number of vacancies rose by only 107 (1.3 percent).
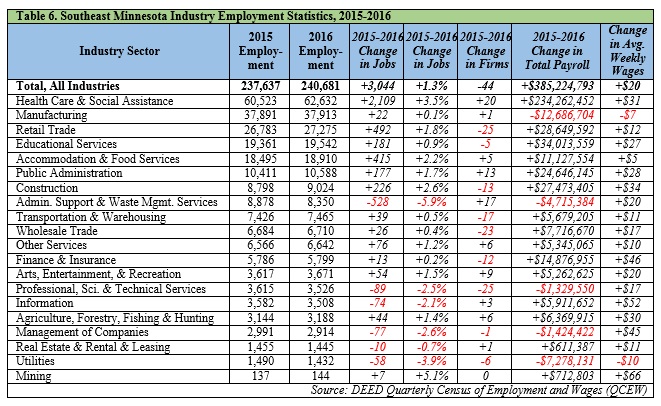
Six of the 20 main industry sectors lost employment from 2015 to 2016, with five of those losing less than 100 jobs. However, administrative support and waste management services – which includes temporary staffing agencies – saw a large loss of 528 jobs. Overall though, the region saw an increase of over 3,000 jobs, led by gains of 415 net new jobs in accommodation and food services, 492 jobs in retail trade, and a whopping 2,109 jobs in health care and social assistance. Interestingly, several of the sectors that lost jobs actually saw an increase in the number of employing establishments, while some of those that saw an increase in jobs saw a decrease in establishments.
In terms of wages, only five sectors saw a decrease in their contribution to the total payroll in the region. For the most part, average weekly wages enjoyed increases ranging from $5 in accommodation and food services to $66 in mining. Given that the cost of living decreased in the region over the last year, this gives workers a little more money to help meet the cost of living needs, pay off bills, build up savings or purchase non-necessity items.
In summation, there are strong signs that the region is doing well. Unemployment rates are declining while jobs and the number of workers are increasing; the cost of living decreased while payrolls and wage offers saw increases. While there is still some work to do to help improve the labor market and economic characteristics of the region, things overall are looking good.
Contact Mark Schultz.