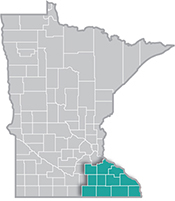
 Southeast Minnesota is a health care and agricultural powerhouse. The region is home to the renowned Mayo Clinic and some of the world's most recognized food companies and brands.
Advanced manufacturing is especially strong here, with machinery, chemicals, and electronics among the top products.
Want the freshest data delivered by email? Subscribe to our regional newsletters.
2/14/2023 9:00:00 AM
Amanda O'Connell
Many events have impacted Minnesota's labor market throughout the past 20 years, including the Great Recession in 2008 and the start of the COVID-19 pandemic in 2020. Even with these significant disruptions, Southeast Minnesota's economy continues to demonstrate resiliency.
According to DEED's Quarterly Census of Employment & Wages program, in the third quarter of 2022, there were 13,438 business establishments providing 241,436 jobs in Southeast Minnesota. Looking back, that means that over the past 20 years, Southeast has gained an additional 1,189 establishments and 13,565 jobs, more than a 6% increase. The industries with the most significant gains in firms in Southeast since 2002 include Health Care & Social Assistance (+1,027 firms), Other Services (+282 firms), and Agriculture, Forestry, Fishing & Hunting (+159 firms).
Interestingly, there was an increase in firms throughout all six planning regions of the state for Health Care & Social Assistance over the past 20 years. Central Minnesota had the largest increase of the six planning regions with an increase of +125.7%, followed by Southeast (+118.7%), and the 7-County Twin Cities metro area (+116.2%). This increase could be due to the significant presence of large healthcare providers in Minnesota, such as Mayo Clinic, Essentia Health, and Sanford Health extending services throughout the state.
All but one planning region, Northeast, had an increase in both firms and jobs in the Agriculture, Forestry, Fishing & Hunting industry. Southwest had the largest rise in firms (+101.7%; +364 firms), followed by Southeast (+63.6%; +159 firms) and Central (+61.8%; +194 firms). This growth reflects Minnesota's strength in agriculture – our state ranks 5th in crop production within the United States, demonstrating the success of established firms, as well as new startups around the state.
The largest increase in the number of jobs came from Health Care & Social Assistance (+16,796 jobs), followed by Management of Companies (+3,369 jobs), and Educational Services (+2,254 jobs). The increase in jobs in the Educational Services industry is due to the addition of 28 new establishments in Southeast, including one new Elementary & Secondary School, five additional Colleges, Universities & Professional Schools, 14 Educational Support Services firms, and 11 Other Schools & Instruction firms. In contrast, the increase in jobs in the Management of Companies industry is mainly due to an industry classification change of companies in the region away from Finance & Insurance.
However, not all industries gained firms and jobs within the last 20 years. The industries with the largest decrease in firms in Southeast included Retail Trade, which lost a net of -447 fewer firms, Wholesale Trade (-135 firms), and Manufacturing (-73 firms). This follows the trend of the other six planning regions in losing Retail Trade and Wholesale Trade firms. However, Southeast took the biggest hit in Retail Trade (-21.9%), followed by Southwest (-387 firms; -21.1%) and Northeast (-305 firms; -19.2%).
In Wholesale Trade, Northeast Minnesota took the largest hit (-103 firms; -28.4%), followed by Southeast (-21.2%), and the 7-County Twin Cities metro region (-19.8%). Lastly, all regions except for Central lost Manufacturing firms in the past 20 years. The Twin Cities region lost -845 firms (-17.1%), followed by Northeast (-16.5%) and Southeast (-9.9%).
The industries with the largest job losses since 2002 include Manufacturing (-8,488 jobs), Retail Trade (-2,529 jobs), and Finance & Insurance (-2,175 jobs). The job reduction in Manufacturing and Retail Trade follows the loss of establishments over time. As noted above, the loss of jobs in the Finance & Insurance industry is due to classification changes of companies.
The number of jobs in various industries have also fluctuated within the past year in Southeast. Since the third quarter of 2021, there has been an increase of 420 reporting firms and 1,429 covered jobs. The industries with the largest gains in firms within the last year include Health Care & Social Assistance (+117 firms), Other Services (+73 firms), and Professional, Scientific, & Technical Services (+51 firms).
The industries with the largest gains in jobs include Manufacturing (+495 jobs), Educational Services (+410 jobs), and Arts, Entertainment, & Recreation (+408 jobs). The increase in Professional, Scientific, & Technical Services firms can be attributed to the rise of research firms in the region. During the early days of the COVID-19 pandemic, the Arts, Entertainment, & Recreation industry took a hit and decreased services within the area, but this industry has rebounded since then.
The largest losses of jobs were seen in Administrative Support & Waste Management Services (-802 jobs), Health Care & Social Assistance (-699 jobs), and Finance & Insurance (-70 jobs). Overall, Southeast Minnesota's economy has shown the ability to bounce back from multiple recessions throughout the past 20 years (Table 1).
| Table 1. Southeast Minnesota Industry Trends (2002-2022) | |||||||
|---|---|---|---|---|---|---|---|
| Industry | Number of Jobs (Q3 2022) | 1-Year Trend (Q3 2021-Q3 2022) | 10-Year Trend (Q3 2012-Q3 2022) | 20-Year Trend (Q3 2002-Q3 2022) | |||
| Numeric Change | Percent Change | Numeric Change | Percent Change | Numeric Change | Percent Change | ||
| Total, All Industries | 241,436 | +1,429 | +0.6% | +6,656 | +2.8% | +13,656 | +6.0% |
| Health Care & Social Assistance | 65,692 | -699 | -1.1% | +4,823 | +7.9% | +16,796 | +34.4% |
| Manufacturing | 36,609 | +495 | +1.4% | -825 | -2.2% | -8,488 | -18.8% |
| Retail Trade | 26,224 | +149 | +0.6% | -778 | -2.9% | -2,529 | -8.8% |
| Accommodation & Food Services | 19,458 | +443 | +2.3% | +725 | +3.9% | +1,801 | +10.2% |
| Educational Services | 17,269 | +410 | +2.4% | +1,784 | +11.5% | +2,254 | +15.0% |
| Public Administration | 11,504 | +42 | +0.4% | +876 | +8.2% | +792 | +7.4% |
| Construction | 10,811 | +104 | +1.0% | +1,975 | +22.4% | -603 | -5.3% |
| Transportation & Warehousing | 7,750 | +281 | +3.8% | +977 | +14.4% | +1,842 | +31.2% |
| Admin. Support & Waste Mgmt. Svcs. | 7,619 | -802 | -9.5% | -2,192 | -22.3% | +1,179 | +18.3% |
| Wholesale Trade | 6,642 | +134 | +2.1% | -147 | -2.2% | +446 | +7.2% |
| Other Services | 6,416 | +119 | +1.9% | +86 | +1.4% | -442 | -6.5% |
| Arts, Entertainment, & Recreation | 4,469 | +408 | +10.1% | +336 | +8.1% | +65 | +1.5% |
| Management of Companies | 4,324 | +222 | +5.4% | +1,524 | +54.4% | +3,369 | +352.8% |
| Finance & Insurance | 4,221 | -70 | -1.6% | -1,724 | -29.0% | -2,175 | -34.0% |
| Professional & Technical Services | 3,616 | +118 | +3.4% | -47 | -1.3% | -859 | -19.2% |
| Agriculture, Forestry, Fish & Hunting | 3,315 | +20 | +0.6% | +365 | +12.4% | +1,253 | +60.8% |
| Information | 2,477 | -40 | -1.6% | -939 | -27.5% | -823 | -24.9% |
| Real Estate & Rental & Leasing | 1,427 | +31 | +2.2% | -159 | -10.0% | -233 | -14.0% |
| Utilities | 1,360 | +58 | +4.5% | -102 | -7.0% | +54 | +4.1% |
| Mining | 228 | +9 | +4.1% | +101 | +79.5% | N/A | N/A |
| Source: DEED Quarterly Census of Employment & Wages | |||||||
Contact Amanda O'Connell, Labor Market Analyst, at amanda.oconnell@state.mn.us
