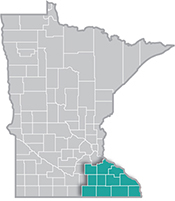
 Southeast Minnesota is a health care and agricultural powerhouse. The region is home to the renowned Mayo Clinic and some of the world's most recognized food companies and brands.
Advanced manufacturing is especially strong here, with machinery, chemicals, and electronics among the top products.
Want the freshest data delivered by email? Subscribe to our regional newsletters.
4/24/2023 9:00:00 AM
Amanda O'Connell
Newly released data from DEED's Job Vacancy Survey showed 19,304 job vacancies in Southeast Minnesota for the second quarter of 2022. This is the second highest number ever reported for the second quarter in the region, with the highest number being the second quarter of 2021, when employers posted 21,510 job vacancies. Southeast made up 10.5% of the total vacancies in the state in 2022 (see Figure 1).

Examining the number of unemployed workers and comparing that to job vacancies demonstrates how tight the labor market is in Southeast. The current ratio of unemployed workers to job vacancies is 0.3-to-1 (or 5,100 unemployed workers compared to 19,304 vacancies in 2022). This is the lowest ratio recorded in Southeast, and certainly contributes to hiring difficulties for employers.
The top occupational groups with the most job vacancies include Food Preparation & Serving Related (4,822 vacancies), Sales & Related (2,248 vacancies), Transportation & Material Moving (1,752 vacancies), Production (1,593 vacancies), and Healthcare Practitioners & Technical Occupations (1,328 vacancies). These occupational groups account for over 60% of all job vacancies in Southeast Minnesota.
| Table 1. Southeast Minnesota Job Vacancy Survey Results, Qtr. 2 2022 | |||||||
|---|---|---|---|---|---|---|---|
| Occupational Group | Number
of Vacancies |
Median Wage | Percent Part-Time | Percent Temporary
or Seasonal |
Requiring Post-Secondary Education | Percent Requiring 1 Plus Years Experience | Percent Requiring Certificate or License |
| Total, All | 19,304 | $16.08 | 41% | 10% | 25% | 42% | 29% |
| Food Preparation & Serving Related | 4,822 | $13.72 | 69% | 4% | 1% | 31% | 4% |
| Sales & Related | 2,248 | $14.59 | 44% | 6% | 2% | 23% | 18% |
| Transportation & Material Moving | 1,752 | $16.97 | 35% | 18% | 0% | 21% | 50% |
| Production | 1,593 | $15.96 | 11% | 1% | 9% | 36% | 10% |
| Healthcare Practitioners & Technical | 1,328 | $31.77 | 36% | 3% | 92% | 83% | 90% |
| Healthcare Support | 1,139 | $15.40 | 47% | 0% | 7% | 12% | 35% |
| Building & Grounds Cleaning & Maint. | 945 | $15.09 | 36% | 44% | 0% | 11% | 4% |
| Construction & Extraction | 924 | $19.83 | 1% | 10% | 31% | 69% | 28% |
| Office & Administrative Support | 828 | $16.86 | 36% | 19% | 17% | 60% | 16% |
| Personal Care & Service | 805 | $15.13 | 49% | 15% | 73% | 14% | 77% |
| Installation, Maintenance, & Repair | 739 | $14.23 | 12% | 2% | 80% | 88% | 11% |
| Educational Instruction & Library | 490 | $20.68 | 38% | 27% | 90% | 77% | 87% |
| Management | 333 | $30.93 | 21% | 8% | 68% | 100% | 55% |
| Business & Financial Operations | 254 | $24.78 | 29% | 5% | 78% | 92% | 38% |
| Computer & Mathematical | 188 | $33.61 | 51% | 2% | 83% | 99% | 35% |
| Architecture & Engineering | 186 | $29.46 | 13% | 11% | 83% | 86% | 39% |
| Community & Social Service | 171 | $23.79 | 14% | 4% | 75% | 64% | 81% |
| Life, Physical, & Social Science | 152 | $24.51 | 65% | 53% | 95% | 96% | 30% |
| Farming, Fishing, & Forestry | 117 | $15.79 | 2% | 0% | 1% | N/A | 4% |
| Arts, Design, Entertainment & Media | 103 | $16.24 | 65% | 28% | 50% | 63% | 33% |
| Protective Service | 100 | $19.68 | 28% | 18% | 22% | 80% | 78% |
| Legal Occupations | 50 | $20.46 | 6% | 0% | 99% | 98% | 92% |
| Internships | 25 | N/A | 48% | 84% | 61% | 45% | 9% |
| Apprenticeships | 12 | $19.26 | 23% | 39% | 25% | 71% | 89% |
| Source: DEED Job Vacancy Survey | |||||||
Across all occupations, 41% of vacancies were part-time, which is up 14% from second quarter 2021. In addition, 10% of job openings were temporary or seasonal. A quarter of job openings required post-secondary education, 42% of job openings required one year of experience, and 29% of jobs required a certificate of license. The median wage offer sat at $16.08 an hour, reflecting openings across the occupation and skill spectrum. Computer & Mathematical occupations had the highest median wage offer with $33.61, followed by Healthcare Practitioner & Technical ($31.77) and Management ($30.93).
Compared to the state of Minnesota, Southeast had higher vacancy rates in 7 of the 24 occupational groups. These occupational groups include Food Preparation & Serving Related (10.5 percentage points higher), Construction & Extraction (2.5 percentage points higher), Production (2.1 percentage points higher), Transportation & Material Moving (1.8 percentage points higher), Personal Care & Service (1.6 percentage points higher), Building & Grounds Cleaning & Maintenance (1.2 percentage points higher), and Installation, Maintenance, & Repair occupations (0.3 percentage points higher).
Contact Amanda O'Connell, Labor Market Analyst, at amanda.oconnell@state.mn.us
