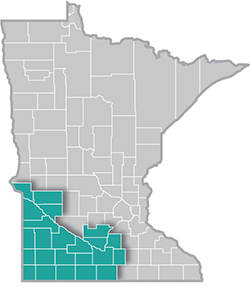
 Southwest Minnesota is a national leader in agricultural production, and renewable energy.
The region's thriving manufacturing sector includes food processing, machinery, printing, metal products, and computers and electronic products.
Want the freshest data delivered by email? Subscribe to our regional newsletters.
5/17/2022 9:00:00 AM
Luke Greiner
Southwest Minnesota welcomed more than 5,700 new foreign-born residents over the past decade, according to new data released by the U.S. Census Bureau. That was a 40% increase from 2010 to 2020, outpacing growth in the state, which increased 28%. The region is now home to more than 20,000 foreign-born residents, accounting for just over 5% of the total population.
This international in-migration helped maintain population growth in the region since 2010 – without these new Minnesotans, the region would have actually lost population over the decade. With 10,125 residents, about half of all immigrants in Southwest Minnesota are from Latin America, with almost 60% of those from Mexico. Nearly 6,000 immigrants are from Asia, and more specifically Southeastern Asia (such as Laos, Thailand, and Vietnam), after increasing more than 63% from 2010. But the fastest in-migration into the region happened from Africa – African in-migration nearly doubled since 2010 and now accounts for just over 2,600 people (see Table 1).
| Table 1. Place of Birth for the Foreign Born Population, 2020 | Southwest Minnesota | Change from 2010-2020 | Minnesota | Change from 2010-2020 | |||
|---|---|---|---|---|---|---|---|
| Number | Percent | Number | Percent | Number | Percent | ||
| Total, Foreign-born Population | 20,170 | 5.1% | 5,729 | 39.7% | 470,687 | 8.2% | 28.3% |
| Europe | 1,176 | 5.8% | -201 | -14.6% | 45,867 | 9.7% | 1.9% |
| Europe: - Northern Europe | 207 | 17.6% | -172 | -45.4% | 8,417 | 18.4% | -6.1% |
| Europe: - Western Europe | 392 | 33.3% | -152 | -27.9% | 10,255 | 22.4% | -2.8% |
| Europe: - Southern Europe | 54 | 4.6% | 22 | 68.8% | 2,668 | 5.8% | 31.8% |
| Europe: - Eastern Europe | 515 | 43.8% | 93 | 22.0% | 24,452 | 53.3% | 4.4% |
| Asia | 5,966 | 29.6% | 2,309 | 63.1% | 174,828 | 37.1% | 28.5% |
| Asia: - Eastern Asia | 1,135 | 19.0% | 278 | 32.4% | 37,314 | 21.3% | 19.7% |
| Asia: - South Central Asia | 838 | 14.0% | 280 | 50.2% | 43,371 | 24.8% | 51.2% |
| Asia: - South Eastern Asia | 3,398 | 57.0% | 1,283 | 60.7% | 84,921 | 48.6% | 19.9% |
| Asia: - Western Asia | 574 | 9.6% | 449 | 359.2% | 8,873 | 5.1% | 74.5% |
| Africa | 2,638 | 13.1% | 1,278 | 94.0% | 125,135 | 26.6% | 78.2% |
| Africa: - Eastern Africa | 1,542 | 58.5% | 835 | 118.1% | 82,990 | 66.3% | 91.7% |
| Africa: - Middle Africa | 6 | 0.2% | -6 | -50.0% | 3,848 | 3.1% | 177.6% |
| Africa: - Northern Africa | 219 | 8.3% | -74 | -25.3% | 6,871 | 5.5% | 39.7% |
| Africa: - Southern Africa | 53 | 2.0% | -19 | -26.4% | 1,693 | 1.4% | 80.7% |
| Africa: - Western Africa | 620 | 23.5% | 450 | 264.7% | 26,735 | 21.4% | 56.9% |
| Oceania | 265 | 1.3% | 166 | 167.7% | 1,846 | 0.4% | 15.4% |
| Americas | 10,125 | 50.2% | 2,177 | 27.4% | 123,011 | 26.1% | 7.8% |
| Americas: - Latin America | 9,797 | 96.8% | 2,302 | 30.7% | 111,190 | 90.4% | 9.6% |
| Latin America: - Central America | 9,006 | 91.9% | 2,080 | 30.0% | 80,406 | 72.3% | 0.8% |
| Central America: - Mexico | 5,222 | 58.0% | 278 | 5.6% | 59,735 | 74.3% | -9.0% |
| Latin America: - South America | 633 | 6.5% | 153 | 31.9% | 23,584 | 21.2% | 36.2% |
| Americas: - Northern America | 328 | 3.2% | -125 | -27.6% | 11,821 | 9.6% | -6.3% |
| Source: U.S. Census Bureau, 2016-2020 American Community Survey | |||||||
While 20 of the 23 counties in the region saw an increase in foreign-born residents over the last 10 years, some counties have benefited more from this international in-migration than others. Nobles County, which is home to Worthington, saw the largest numeric increase and immigrants now account for over 20% of the county's population - or one in every five residents. With 12.7% of the population reporting as foreign-born, Watonwan County also has among the highest concentrations of immigrants in the state, but did not see much growth over the past decade.
Instead, the fastest increases in in-migration occurred in Big Stone, Murray, Rock, and Chippewa counties, which all doubled from 2010 to 2020. However, all four of those counties also have relatively small numbers of immigrants, with the first three all having less than 260 foreign-born residents, and Chippewa having about 750.
Finally, three counties in the region actually saw a decline in the number of foreign-born residents over the past 10 years, with Lincoln, Le Sueur, and Martin all losing about 30 immigrants. The smallest counties in the region tended to have the smallest foreign-born populations, with Swift, Faribault, Murray, Rock, and Yellow Medicine all having between 200 and 300 immigrants; Lac qui Parle having 155, and Big Stone and Lincoln both having less than 60 foreign-born residents (see Table 2).
| Table 2. Foreign-born Population, 2020 | 2020 Pop. Estimate | 2010-2020 Change | ||
|---|---|---|---|---|
| Number | Percent | Number | Percent | |
| Nobles County | 4,540 | 20.4% | +1,381 | +43.7% |
| Watonwan County | 1,433 | 12.7% | +93 | +6.9% |
| Lyon County | 1,889 | 7.5% | +636 | +50.8% |
| Cottonwood County | 718 | 6.2% | +229 | +46.8% |
| Pipestone County | 573 | 6.1% | +270 | +89.1% |
| Chippewa County | 754 | 6.0% | +383 | +103.2% |
| Blue Earth County | 3,615 | 5.2% | +1,111 | +44.4% |
| Sibley County | 726 | 4.9% | +169 | +30.3% |
| Nicollet County | 1,447 | 4.2% | +506 | +53.8% |
| Jackson County | 370 | 3.7% | +91 | +32.6% |
| Waseca County | 613 | 3.2% | +125 | +25.6% |
| Murray County | 257 | 3.1% | +136 | +112.4% |
| Swift County | 296 | 3.0% | +90 | +43.7% |
| Redwood County | 381 | 2.5% | +46 | +13.7% |
| Brown County | 632 | 2.4% | +213 | +50.8% |
| Rock County | 233 | 2.4% | +121 | +108.0% |
| Lac qui Parle County | 155 | 2.3% | +62 | +66.7% |
| Yellow Medicine County | 211 | 2.2% | +68 | +47.6% |
| Le Sueur County | 632 | 2.2% | -30 | -4.5% |
| Faribault County | 274 | 2.0% | 60 | 28.0% |
| Martin County | 305 | 1.5% | -26 | -7.9% |
| Big Stone County | 58 | 1.1% | 31 | 114.8% |
| Lincoln County | 58 | 1.0% | -36 | -38.3% |
| Source: U.S. Census Bureau, American Community Survey | ||||
Contact Labor Market Analysts Luke Greiner at 320-308-5378 or Mark Schultz.
