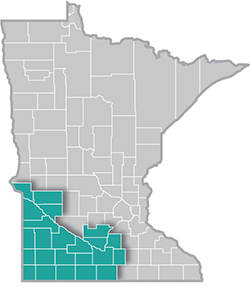
 Southwest Minnesota is a national leader in agricultural production, and renewable energy.
The region's thriving manufacturing sector includes food processing, machinery, printing, metal products, and computers and electronic products.
Want the freshest data delivered by email? Subscribe to our regional newsletters.
2/14/2023 9:00:00 AM
Luke Greiner, Amanda O'Connell
Newly released data show that the economic recovery is continuing in Southwest Minnesota, with the 23-county region adding almost 3,000 net new jobs over the past year. According to data from the third quarter of 2022 in DEED's Quarterly Census of Employment & Wages program, Southwest gained 2,994 additional jobs compared to the third quarter of 2021, a 1.8% increase. While the region is still behind its pre-pandemic employment level, it is now back to 97.3% of the 2019 job count.
Encouragingly, 15 of the 23 counties in the region added jobs over the past year, with the biggest gains seen in Blue Earth and Nicollet County, which make up the Mankato-North Mankato metropolitan area. Combined, those two counties regained 2,150 jobs from 2021 to 2022, accounting for over 70% of the entire region's job growth. In the rest of the area, the fastest growth occurred in Pipestone and Cottonwood County, which both expanded more than 4%. Eight counties saw job declines over the year, with the biggest drop recorded in Waseca County, which lost 225 jobs from 2021 to 2022 (see Table 1).
| Table 1. Employment Change in Southwest Minnesota | Change in Jobs | |||||||||
|---|---|---|---|---|---|---|---|---|---|---|
| - | Number of Jobs | Q3 2019-Q3 2022 | Q3 2020-Q3 2022 | Q3 2021-Q3 2022 | ||||||
| - | Qtr. 3 2022 | Qtr. 3 2021 | Qtr. 3 2020 | Qtr. 3 2019 | Number | Percent | Number | Percent | Number | Percent |
| Big Stone Co. | 1,700 | 1,727 | 1,699 | 1,736 | -36 | -2.1% | +1 | +0.1% | -27 | -1.6% |
| Blue Earth Co. | 38,226 | 36,859 | 36,360 | 39,820 | -1,594 | -4.0% | +1,866 | +5.1% | +1,367 | +3.7% |
| Brown Co. | 13,024 | 13,090 | 12,986 | 14,171 | -1,147 | -8.1% | +38 | +0.3% | -66 | -0.5% |
| Chippewa Co. | 5,198 | 5,311 | 5,246 | 5,662 | -464 | -8.2% | -48 | -0.9% | -113 | -2.1% |
| Cottonwood Co. | 5,804 | 5,569 | 5,152 | 5,091 | +713 | +14.0% | +652 | +12.7% | +235 | +4.2% |
| Faribault Co. | 4,750 | 4,576 | 4,458 | 4,642 | +108 | +2.3% | +292 | +6.6% | +174 | +3.8% |
| Jackson Co. | 4,812 | 4,814 | 4,936 | 5,067 | -255 | -5.0% | -124 | -2.5% | -2 | 0.0% |
| Lac qui Parle Co. | 2,066 | 2,018 | 1,983 | 2,138 | -72 | -3.4% | +83 | +4.2% | +48 | +2.4% |
| Le Sueur Co. | 8,770 | 8,803 | 8,672 | 9,156 | -386 | -4.2% | +98 | +1.1% | -33 | -0.4% |
| Lincoln Co. | 1,554 | 1,524 | 1,492 | 1,684 | -130 | -7.7% | +62 | +4.2% | +30 | +2.0% |
| Lyon Co. | 13,512 | 13,308 | 12,976 | 13,842 | -330 | -2.4% | +536 | +4.1% | +204 | +1.5% |
| Martin Co. | 8,218 | 8,098 | 8,047 | 8,525 | -307 | -3.6% | +171 | +2.1% | +120 | +1.5% |
| Murray Co. | 2,859 | 2,817 | 2,798 | 2,917 | -58 | -2.0% | +61 | +2.2% | +42 | +1.5% |
| Nicollet Co. | 15,389 | 14,606 | 14,045 | 15,203 | +186 | +1.2% | +1,344 | +9.6% | +783 | +5.4% |
| Nobles Co. | 10,160 | 10,245 | 10,214 | 10,451 | -291 | -2.8% | -54 | -0.5% | -85 | -0.8% |
| Pipestone Co. | 4,457 | 4,251 | 4,214 | 4,601 | -144 | -3.1% | +243 | +5.8% | +206 | +4.8% |
| Redwood Co. | 6,067 | 5,921 | 5,844 | 6,021 | +46 | +0.8% | +223 | +3.8% | +146 | +2.5% |
| Rock Co. | 3,576 | 3,510 | 3,377 | 3,256 | +320 | +9.8% | +199 | +5.9% | +66 | +1.9% |
| Sibley Co. | 4,322 | 4,332 | 4,301 | 4,499 | -177 | -3.9% | +21 | +0.5% | -10 | -0.2% |
| Swift Co. | 3,571 | 3,472 | 3,296 | 3,597 | -26 | -0.7% | +275 | +8.3% | +99 | +2.9% |
| Waseca Co. | 5,779 | 6,004 | 5,944 | 6,225 | -446 | -7.2% | -165 | -2.8% | -225 | -3.7% |
| Watonwan Co. | 4,407 | 4,375 | 4,249 | 4,291 | +116 | +2.7% | +158 | +3.7% | +32 | +0.7% |
| Yellow Medicine Co. | 3,675 | 3,671 | 3,770 | 4,023 | -348 | -8.7% | -95 | -2.5% | +4 | +0.1% |
| Southwest Minnesota | 171,903 | 168,909 | 166,068 | 176,626 | -4,723 | -2.7% | +5,835 | +3.5% | +2,994 | +1.8% |
| Minnesota | 2,880,269 | 2,797,752 | 2,684,218 | 2,917,014 | -36,745 | -1.3% | +196,051 | +7.3% | +82,517 | +2.9% |
| Source: DEED Quarterly Census of Employment & Wages | ||||||||||
Six counties in the region have more jobs now than before the pandemic recession, with Cottonwood County up 14% compared to 2019, and Rock County up nearly 10%. Watonwan, Faribault, Nicollet, and Redwood County have also experienced growth despite the economic uncertainty of the past three years. In contrast, Yellow Medicine, Chippewa, Brown, and Lincoln are all furthest behind their 2019 employment levels, each holding at around 92% of their prior job counts.
Looking at job growth from another perspective, 15 of the 20 main industries in the region also saw steady employment growth in the past year. This included a huge 1,115 job gain in Manufacturing, which has topped 2019 employment numbers by nearly 900 jobs. With more than 33,000 jobs, Manufacturing remains the largest industry in the region, accounting for one in every five jobs. Health Care & Social Assistance regained 200 jobs over the past year, but is still down almost 2,500 jobs from 2019 (see Table 2).
| Table 2. Employment Change in Southwest Minnesota | Change in Jobs | |||||||
|---|---|---|---|---|---|---|---|---|
| NAICS Industry Title | Number of Firms | Number of Jobs | Q3 2019-Q3 2022 | Q3 2020-Q3 2022 | Q3 2021-Q3 2022 | |||
| Number | Percent | Number | Percent | Number | Percent | |||
| Total, All Industries | 12,880 | 171,903 | -4,723 | -2.7% | +5,835 | +3.5% | +2,994 | +1.8% |
| Agriculture, Forestry, Fish & Hunting | 722 | 5,319 | -136 | -2.5% | -274 | -4.9% | -91 | -1.7% |
| Mining | 23 | 239 | -102 | -29.9% | -19 | -7.4% | -6 | -2.4% |
| Construction | 1,576 | 8,991 | -479 | -5.1% | +129 | +1.5% | +114 | +1.3% |
| Manufacturing | 634 | 33,172 | +884 | +2.7% | +2,657 | +8.7% | +1,115 | +3.5% |
| Utilities | 77 | 897 | -74 | -7.6% | -39 | -4.2% | -24 | -2.6% |
| Wholesale Trade | 655 | 7,541 | -187 | -2.4% | +15 | +0.2% | +288 | +4.0% |
| Retail Trade | 1,447 | 19,282 | +276 | +1.5% | +925 | +5.0% | +469 | +2.5% |
| Transportation & Warehousing | 787 | 6,660 | -444 | -6.3% | -187 | -2.7% | -84 | -1.2% |
| Information | 200 | 2,050 | -452 | -18.1% | -77 | -3.6% | +47 | +2.3% |
| Finance & Insurance | 715 | 5,940 | -13 | -0.2% | -296 | -4.7% | +18 | +0.3% |
| Real Estate & Rental & Leasing | 280 | 1,402 | -60 | -4.1% | +72 | +5.4% | +60 | +4.5% |
| Professional & Technical Services | 612 | 3,776 | -22 | -0.6% | +227 | +6.4% | +158 | +4.4% |
| Management of Companies | 53 | 1,339 | -77 | -5.4% | -130 | -8.8% | -118 | -8.1% |
| Admin. Support & Waste Mgmt. Svcs. | 418 | 4,121 | -102 | -2.4% | +615 | +17.5% | +248 | +6.4% |
| Educational Services | 236 | 12,214 | -264 | -2.1% | +674 | +5.8% | +141 | +1.2% |
| Health Care & Social Assistance | 1,659 | 29,398 | -2,470 | -7.8% | -457 | -1.5% | +202 | +0.7% |
| Arts, Entertainment & Recreation | 246 | 2,320 | -30 | -1.3% | +265 | +12.9% | +55 | +2.4% |
| Accommodation & Food Services | 849 | 11,730 | -778 | -6.2% | +1,110 | +10.5% | +128 | +1.1% |
| Other Services | 1,105 | 4,984 | -69 | -1.4% | +454 | +10.0% | +86 | +1.8% |
| Public Administration | 586 | 10,523 | -122 | -1.1% | +174 | +1.7% | +189 | +1.8% |
| Source: DEED Quarterly Census of Employment & Wages | ||||||||
Already the smallest industry in the region by job count, Mining is also the farthest away from its pre-pandemic employment level after losing more than 100 jobs since 2019. Despite gaining almost 50 jobs in the past year, Information is also way behind its 2019 job count in 2022. Overall, 18 of 20 industries have not fully regained the jobs lost in the pandemic recession.
In addition to Manufacturing, the other industry that has gained jobs since 2019 in the region is Retail Trade. This includes job growth in Gas Stations, General Merchandise Stores, and Sporting Goods, Hobby, Musical Instrument, Book, and Miscellaneous Retailers. Finance & Insurance, Professional & Technical Services, Public Administration, Other Services, and Arts, Entertainment & Recreation are all within 2% of breakeven as well.
Contact Luke Greiner at luke.greiner@state.mn.us or Amanda O'Connell at amanda.oconnell@state.mn.us.
