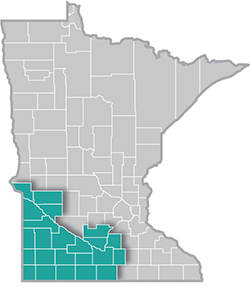
 Southwest Minnesota is a national leader in agricultural production, and renewable energy.
The region's thriving manufacturing sector includes food processing, machinery, printing, metal products, and computers and electronic products.
Want the freshest data delivered by email? Subscribe to our regional newsletters.
10/27/2023 9:00:00 AM
Luke Greiner, Amanda O'Connell
With nearly 30,000 residents, almost 7.5% of Southwest Minnesota's population reported being of Hispanic or Latino origin in 2021. At that rate, Southwest has the highest concentration of Hispanic or Latino residents of the six planning regions in the state, nearly 2% above the state as a whole and more than four times above Northeast (see Figure 1).

While the region's total population increased less than 1% over the past decade, the region welcomed more than 9,000 additional Hispanic or Latino residents, a 45% increase. The region saw a small decline in the number of residents reporting white alone as their race, which may reflect the aging of the population, but also saw huge increases in the number of people of Some Other Race or Two or More Races, which may reflect changes in how people report their race identity. It is important to note that Hispanic or Latino is an origin category, so people can be of any race and Hispanic or Latino, which likely adds to some confusion in responses and accounts for some of the change (see Table 1).
| Table 1. Race and Hispanic Origin, 2021 | ||||||
|---|---|---|---|---|---|---|
| - | Southwest Minnesota | Minnesota | ||||
| Number | Percent | Change from 2011 - 2021 | Change from 2011 - 2021 | |||
| Numeric | Percent | |||||
| Total | 397,922 | 100.0% | +3,263 | +0.8% | 100.0% | +7.4% |
| White | 356,872 | 89.7% | -14,045 | -3.8% | 80.7% | +0.4% |
| Black or African American | 7,878 | 2.0% | +2,801 | +55.2% | 6.6% | +42.2% |
| American Indian & Alaska Native | 2,479 | 0.6% | +143 | +6.1% | 0.9% | -8.0% |
| Asian & Other Pac. Islander | 7,327 | 1.8% | +1,792 | +32.4% | 5.0% | +35.8% |
| Some Other Race | 9,837 | 2.5% | +4,339 | +78.9% | 2.1% | +66.5% |
| Two or More Races | 13,529 | 3.4% | +8,233 | +155.5% | 4.6% | +121.8% |
| Hispanic or Latino origin | 29,344 | 7.4% | +9,086 | +44.9% | 5.6% | +31.6% |
| Source: U.S. Census Bureau, 2017-2021 American Community Survey | ||||||
Either way, this rapid rise in Hispanic or Latino residents has been a boost to Southwest Minnesota's workforce, with more than 14,100 workers reporting Hispanic or Latino origin in 2021. That means 6.6% of the region's total workforce is Hispanic or Latino, compared to 5.2% statewide. More importantly, the number of Hispanic or Latino workers increased by 5,165 workers over the past decade, a 58% rise. Without that gain, Southwest Minnesota's labor market would be even tighter, and employers would have a harder time filling jobs.
With a much younger population overall and a larger percentage of people in their prime working years (25-54 years), the labor force participation rate for Hispanic or Latino residents was 75.5% in 2021. That was the second highest rate among the different demographic categories, and was about 8.5% above the white labor force participation rate of 66.9% (see Table 2).
| Table 2. Employment Characteristics, 2021 | ||||||||
|---|---|---|---|---|---|---|---|---|
| Southwest Minnesota | Minnesota | Percent of Total Labor Force | ||||||
| In Labor Force | Labor Force Partic. Rate | Unemp. Rate | Labor Force Partic. Rate | Unemp. Rate | Southwest Minnesota | Minnesota | ||
| Total Labor Force | 212,517 | 67.1% | 3.4% | 69.2% | 4.0% | |||
| Employment Characteristics by Race & Hispanic Origin | ||||||||
| White alone | 193,387 | 66.9% | 3.0% | 68.5% | 3.4% | 91.0% | 82.6% | |
| Black or African American | 3,677 | 66.4% | 7.6% | 71.9% | 8.6% | 1.7% | 6.0% | |
| American Indian & Alaska Native | 1,068 | 59.0% | 3.7% | 57.4% | 12.9% | 0.5% | 0.7% | |
| Asian or Other Pac. Islanders | 3,866 | 66.1% | 6.3% | 72.7% | 4.1% | 1.8% | 5.0% | |
| Some Other Race | 4,960 | 73.0% | 5.2% | 75.8% | 6.2% | 2.3% | 2.1% | |
| Two or More Races | 5,563 | 76.1% | 8.8% | 74.1% | 7.3% | 2.6% | 3.5% | |
| Hispanic or Latino | 14,102 | 75.5% | 8.4% | 77.0% | 6.6% | 6.6% | 5.2% | |
| Source: 2017-2021 American Community Survey 5-Year Estimates | ||||||||
According to data from the Quarterly Workforce Indicators program, the industry with the largest number of jobs held by Hispanic or Latino workers was Manufacturing. While Manufacturing employment has been declining over the past 20 years, the number of Hispanic or Latino jobholders has been steadily going up. The next largest employing industries were Health Care & Social Assistance, Accommodation & Food Services, and Agriculture, Forestry, Fishing & Hunting.
If trends persist, we can expect the Hispanic or Latino population and workforce to continue to grow in Southwest Minnesota. And if you are curious and want to learn more about the Hispanic or Latino Minnesotans, I recommend the Minnesota Council on Latino Affairs' demographic and socioeconomic report: "A Portrait of Hispanic/Latinx in Minnesota" and DEED's own report on Hispanic or Latino Minnesotans.
Contact Luke Greiner at luke.greiner@state.mn.us or Amanda O'Connell at amanda.oconnell@state.mn.us.
