
by Alessia Leibert
December 2024
 Career & Technical Education (CTE) programs offer students the opportunity to explore and start preparing for careers while in high school. To maximize the benefits of participation in CTE1, students must transition into employment opportunities relevant to their chosen career pathway or combine their initial career-focused training with a postsecondary credential. This article presents new research, accessible through the High School Technical Education Pathways and Outcomes tool, to answer four key questions:
Interactive filters allow to slice the data by six regions and 56 course topics.
The first visualization in the tool, reproduced in Figure 1, shows the earnings trajectories of individuals who took coursework in two topics: Accounting and Keyboarding/Computer Applications for Business. Accounting has the fastest growth, indicating higher future earnings potential. It also helps people attain a living wage by age 23 when five-year wages were measured: $36,460 is higher than the $34,704 living wage estimate for a single person2.
Earnings outcomes cannot be directly attributed to CTE participation, unless we use the Educational Attainment filter to differentiate between college and no-college tracks. That's because most of the factors that influence earnings, such as family income and academic performance, also correlate with postsecondary educational attainment. For example, the reason for higher earnings in Accounting is that the majority (51%) of participants completed a Bachelor's degree or higher credential. So, their earnings are likely influenced more by postsecondary education and choice of college major than by CTE coursework, per se.
The effect of CTE course-taking on earnings is more directly observable in the "never enrolled in secondary" and "enrolled but did not complete" groups. For these students, high school CTE represents the only, or most relevant, occupational training completed. Employers might take this specific knowledge into account in their hiring decisions; in fact, some employers recruit directly from high school CTE programs. The earnings outcomes of CTE students who never enrolled in postsecondary school3 are of particular interest to future students and policymakers, because they represent the purest stand-alone measure of market value for high school CTE programs.
The second visualization in the tool, reproduced in Figure 2, helps identify which CTE course topics require additional postsecondary education to boost earnings. Our analysis is based on two metrics: the share of employed individuals who obtained a postsecondary credential, broken down by four educational categories (represented by the horizontal bars), and the median hourly wage in the fifth year after high school within each educational category. The fifth year after high school represents the point in time when college students are almost done with school and start looking for fulltime jobs4, making earnings more comparable across educational tracks.
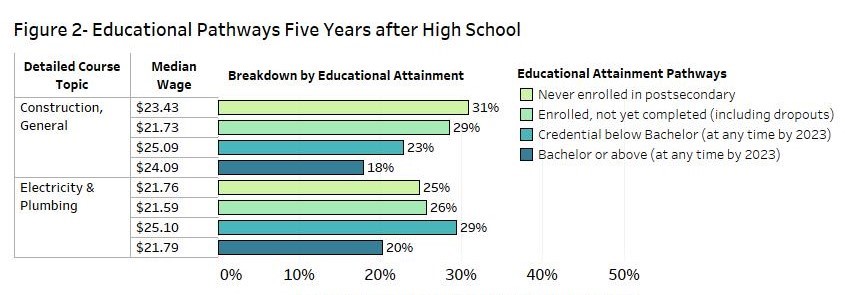
The two programs displayed in Figure 2 are related to construction. They have a very high share of participants in the "never enrolled in postsecondary" track: 31% in the case of Construction, General and 25% in the case of Electricity and Plumbing. Median wages offer a clue to why this is happening. There is hardly any difference between wages in the yellow bars and in the dark blue bars. In the case of Plumbing, the yellow bar has the same exact wages as the dark blue bar. Only a minority of students in these programs completed a postsecondary credential: CTE training equipped them for a good job without further education.
What makes these courses, as well as other skilled-trades courses like Vehicle Repair and Metal Working, so successful at preparing students for immediate workforce entry? There are several reasons. First, these courses give students the opportunity to earn industry-recognized certifications (such as OSHA, or welding) before age 18. Second, employers tend to be engaged in these programs, from participating in curriculum design to offering internships or apprenticeships. Third, employers like to recruit directly from these programs not only because their curricula are aligned with their needs, but also because it's more economical to hire individuals right out of high school and put them through on-the-job training than to hire college graduates with higher salary expectations or skills that may not match business needs.
It is worth noting that these programs, like the careers they prepare for - plumbers, electricians, roofers, carpenters - are heavily male-dominated. Previous research (Leibert, Males in Career and Technical Education) showed that CTE has been effective at boosting job security and wages among males.
Other CTE programs, such as those related to Healthcare, perform best when they help students prepare for postsecondary education. This evidence can be very helpful to students interested in knowing how much their earnings potential can be increased by obtaining a college degree after completing CTE coursework in a specific topic. It can also help school districts identify CTE programs that serve predominantly college-bound students and would greatly benefit from connections to postsecondary schools in the form of dual enrollment and credit transfer opportunities.
The third visualization, reproduced in Figure 3, helps identify programs where employment is related to the topic studied in high school. Figure 3 presents the leading employers for course participants5, displayed as horizontal bar charts ranked by the share of participants employed in each industry. The longest bar represents totals, not broken down by industry. The second outcome of interest is the median hourly wage earned in each industry five years after high school graduation.
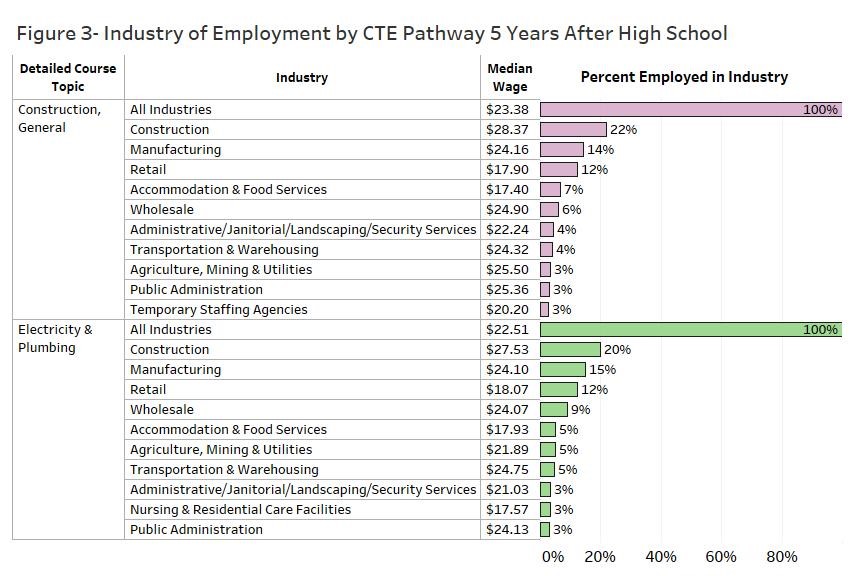
We find that 22% of students who took CTE courses in Construction and 20% of those who took courses in Electricity & Plumbing were employed in the Construction industry five years after high school. Wages in Construction were higher than in other industry sectors, and far above the Minnesota estimated living wage for a single person of $16.686.
Students select courses and types of industries that interest them, so it's not surprising to find high shares of employment in Construction. However, industries don't always tie directly to career choices. For example, 7% of students with CTE coursework in construction found jobs in Accommodation & Food Services, which is completely unrelated. The industries with the highest wages (Construction, Manufacturing, Wholesale Trade, Transportation and Public Administration) are those where construction-related skills are in highest demand.
If we use the filter to drill down to students never enrolled in postsecondary, we see even higher shares of employment in Construction: 30% percent for Construction programs and 26% for Electricity & Plumbing programs. This evidence demonstrates that Construction-related CTE programs were extremely effective at helping participants secure employment in related industries at good wages without investments in postsecondary education. This is the first core mission of CTE.
The second core mission of CTE is to prepare students for postsecondary education. Some CTE courses, such as Advanced Placement Computer Science and all courses branded as Project Lead the Way, allow participants to earn college credit. How can we evaluate the effectiveness of CTE in achieving this mission when industry pathways in the fifth year are more likely to be driven by choice of college major than by high school CTE?
Finding a similarity between high school CTE course topics and industries of employment could indicate that participants pursued majors within the same career pathway they started through high school CTE. This seems to be the case in two engineering-related CTE programs, Electrical/Electronic Engineering and Robotics, shown in Figure 4. For this analysis we filtered only students who eventually completed a postsecondary credential.
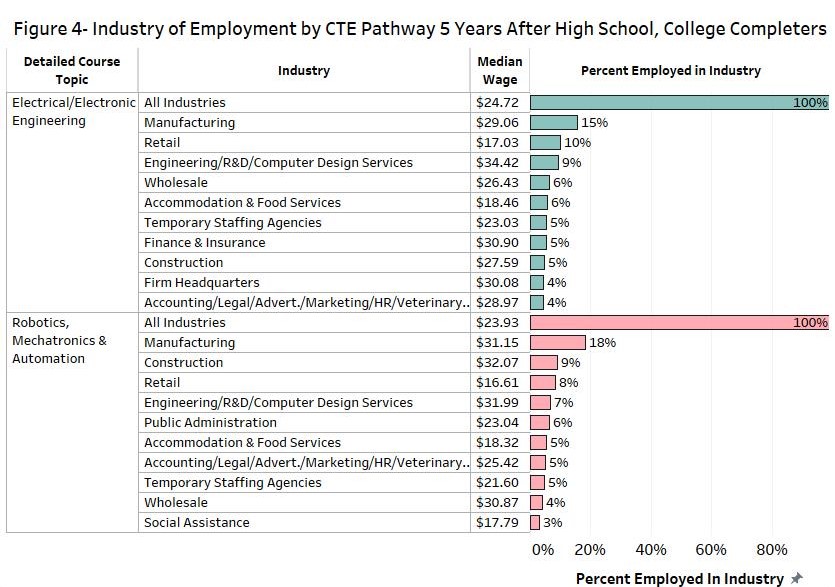
The top industry of employment for both programs is Manufacturing (15% and 18% respectively), an excellent fit for the programs' occupational focus. Other individuals found employment in Engineering/Research or Development/Computer Design Services firms (9% and 7% respectively), where median wages were even higher than in Manufacturing (above $31 per hour). This evidence suggests that high school CTE coursework in these specific topics prepared students for further education, contributed to the students' choice of where to work and likely influenced their choice of college major.
Comparing industry pathways across programs helps students identify areas of opportunity, where they are more likely to be placed in industries that match their career goals, and areas of risk, where industry placement is not a good match. It also helps CTE program administrators evaluate the alignment of their programs with business needs in their region.
The fourth visualization, reproduced in Figure 5, helps identify areas of opportunity for CTE program expansion based on a Supply/Demand comparison. One way to assess labor supply and labor demand is simply to look at the number of jobs available in a region and compare it to the number of individuals with the skills or experience needed to work in these jobs. Our data captures labor supply, defined as individuals who participated in occupational training through CTE and were available for work in Minnesota five years after high school exit7.
Labor demand is harder to measure. We can approximate it by using earnings as an indicator of demand for workers with specific skills. The greater the need for workers with training in a course topic, the higher the wages employers are willing to pay. A shortage might exist when courses have relatively few students enrolled and available for work, leading to higher wage offers.
Figure 5 compares the number of students enrolled in each program and employed (horizontal axis) to the annual earnings (vertical axis) they attained five years after high school. For this example we filtered only students who attended school in the Twin Cities Metro because supply/demand analyses are more meaningful at the regional level. The chart plots 49 course topics displayed as colored dots.
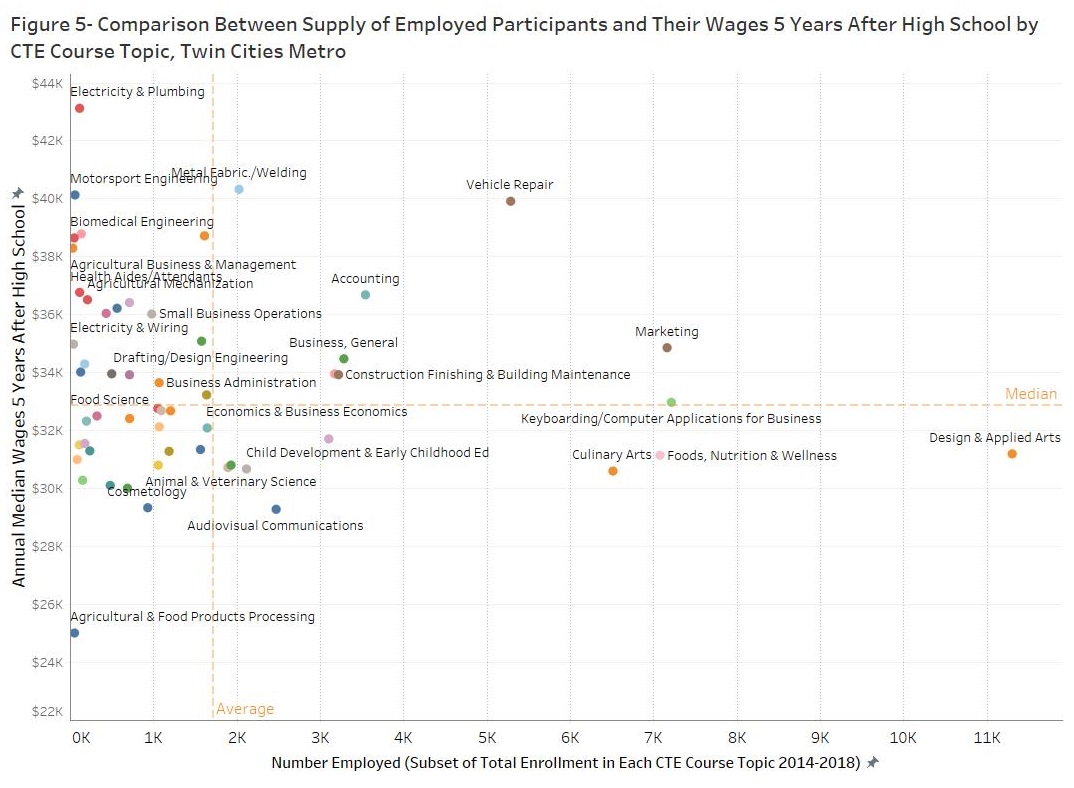
The vertical orange line represents average employment size, and the horizontal orange line represents median annual wages across all CTE programs in this region. Both lines change dynamically to reflect each region's different earnings outcomes and program sizes. The lines map out four quadrants representing different areas of opportunity/risk:
Imbalances in supply fall in the top left (potential under-supply of participants) or bottom right quadrant (potential over-supply).
Two patterns stand out:
An important question for students to reflect upon is the following: Is it worth using hours in my busy school schedule for courses with no specific occupational focus to learn skills that could be self-taught, like Photography or Baking? Am I better off choosing more marketable CTE coursework, or more academic coursework, rather than CTE?
When exploring the tool, users will discover differences in pathways and outcomes by region. The main sources of regional variability are:
 The evidence presented in the tool and summarized in this article suggests that investments in high school CTE can help build a regional workforce, but some types of courses boost students' economic success more than others. Here is a summary of findings:
This information can help high school students and their families make well-informed decisions about enrollment in CTE. It can also assist CTE program administrators gain an understanding of the economic success of course participants for program planning and improvement purposes.
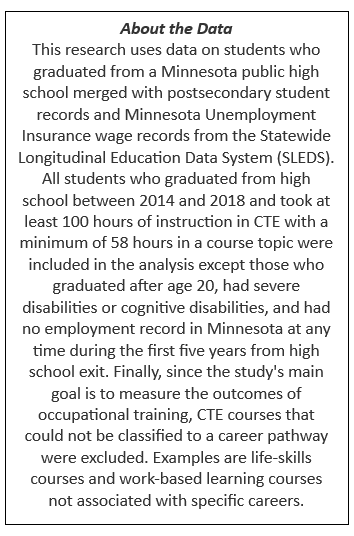
1In this study, CTE participation is defined as taking 100 hours (or more) of CTE instruction with a minimum of 58 hours within a specific course topic . Course topics are defined based on the Classification of Instructional Program (CIP), the same used for organizing majors at the postsecondary level. Additional criteria for exclusion from this study are: not having achieved proficiency in the CTE course; having taken CTE courses only in 9th grade or in Middle School; being severely disabled or cognitively disabled; having no employment record in Minnesota from 1 to 5 years after high school graduation.
2According to the cost of living tool, $34,704 is the minimum annual wage needed to sustain a single person in 2023.
3The earnings outcomes of the Never Enrolled in Postsecondary group are the most directly attributable to high school CTE for two main reasons: First, earnings do not depend on postsecondary choices that could have diverted students from their CTE career pathway. For example, the fifth-year earnings of a student who took Keyboarding courses in high school and later pursued an Engineering major are attributable to the Engineering coursework more than the Keyboarding coursework. Second, non-college bound students tend to have similar demographic and socio-economic characteristics that differentiate them from college-bound students.
4Six years is the Bachelor's degree completion cutoff used by the US Department of Labor.
5In the absence of information on students' specific job roles, we use industry as a measure of alignment with employer needs. For example, we can't tell whether a Nursing Assistant course participant was employed as a Nursing Assistant, but we know whether he/she was employed in the Healthcare industry.
6According to DEED's Cost of Living tool, $21.58 is the minimum wage needed to sustain a typical family in Minnesota.
7We restricted our measure of supply to individuals who were employed in Minnesota five years after high school graduation because alternative measures of supply are less reliable. The total number of students enrolled in each CTE program would overstate the number of individuals available for work, because Minnesota loses approximately 30% of its high school graduates to other states. According to the SLEDS data, 31% (11,300) of the 2022 high-school graduates who enrolled in college the fall after their graduation were enrolled in a state outside of Minnesota. Only a subset return to Minnesota in the post-college years. Source: Minnesota State Demographic Center (2024) An Analysis of Migration Trends and Patterns in Minnesota (2024), page 15.
8This course topic includes courses in Sewing, Graphic Design and Photography.